
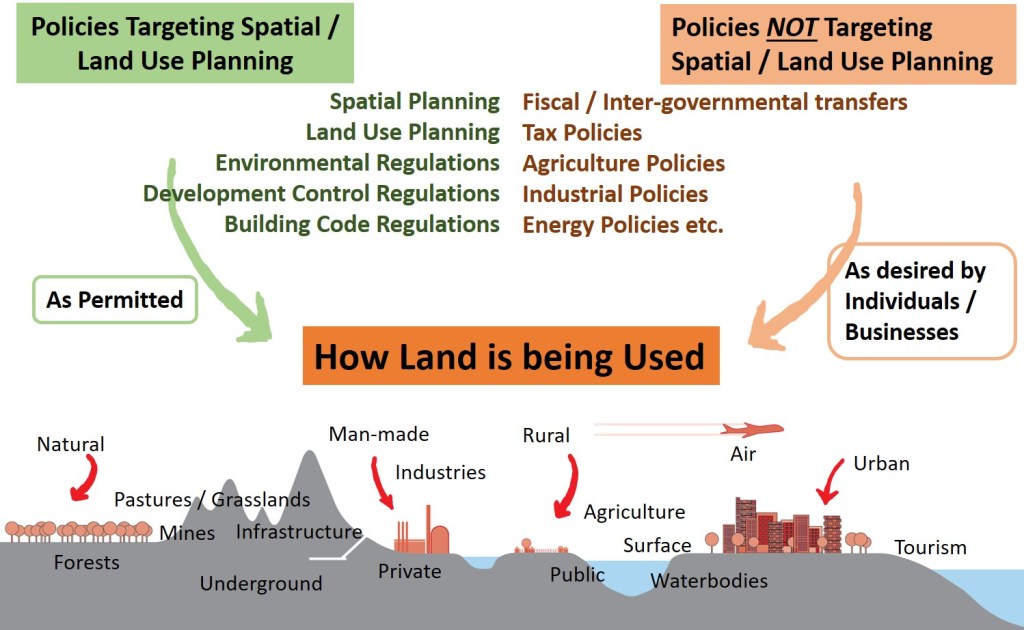
Visualise how land is being used globally, and the sectoral significance in terms forests, water, agriculture, settlements etc. We also look at how Constitution of India deals with Land and introduce ourselves to the relationship of spatial planning with different public policies. This chapter is part of a series on Hierarchical Spatial Planning Framework
“Climate change, population growth, rapid urbanisation, food insecurity and water scarcity – have increased competition for resources and heightened tensions and instability.”
António Guterres, Secretary General of the United Nations, while taking oath in 2017
Land is a finite resource.
We have seen how land is being used.
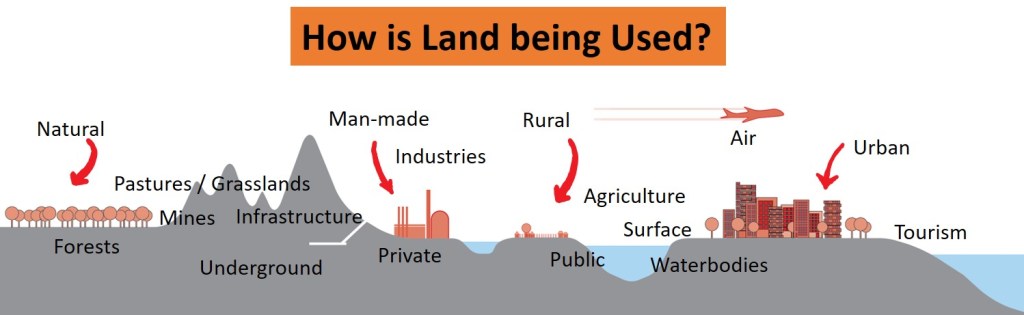
Let us have a look at the Land Use at global level.
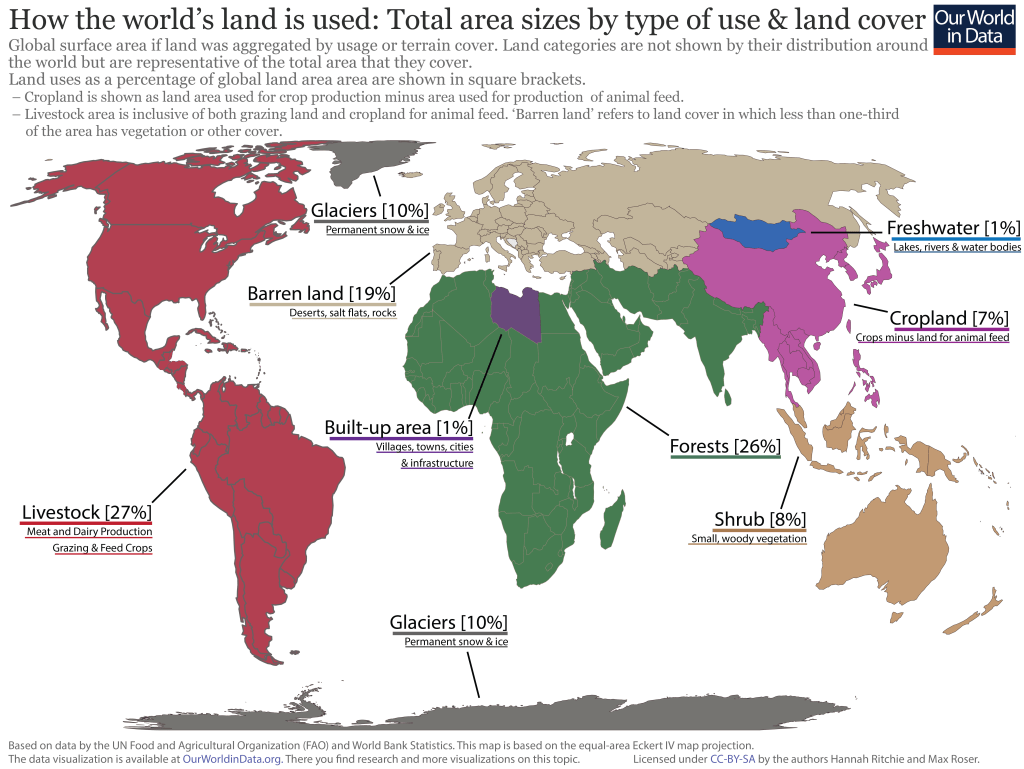
According to the United Nations Food and Agricultural Organisation and World Bank statistics, the approximate global land use comprises of agriculture (34 per cent) wherein livestock accounts from 27 per cent (including grazing and feed crops), and rest of crop land accounts for about 7 per cent. This is followed by Forests (26 per cent), barren land (19 per cent), glaciers (10 per cent), shrubs (8 per cent), built-up area (1 per cent including all villages, towns, cities and infrastructure, industries etc.) and freshwater (1 per cent including all lakes, rivers and water bodies).
OurWorldinData.org has undertaken some brilliant data visualisations. The image below tries to equate these areas by totalling country areas for better visualisation.
In demographics, the world population is the total number of humans currently living, and was estimated to have reached 7.8 billion people as of March 2020. It took over 200,000 years of human history for the world’s population to reach 1 billion, and only 200 years more to reach 7 billion. It is further projected to reach about 10 billion in 2050 and more than 11 billion in 2100. (read more here)
There are two extremely basic things for sustaining life – Food and Fresh Water.
We know that freshwater accounts for only 1 per cent of global land use. So, let us discuss agriculture first.
Land use change under pressures from agriculture and livestock sector
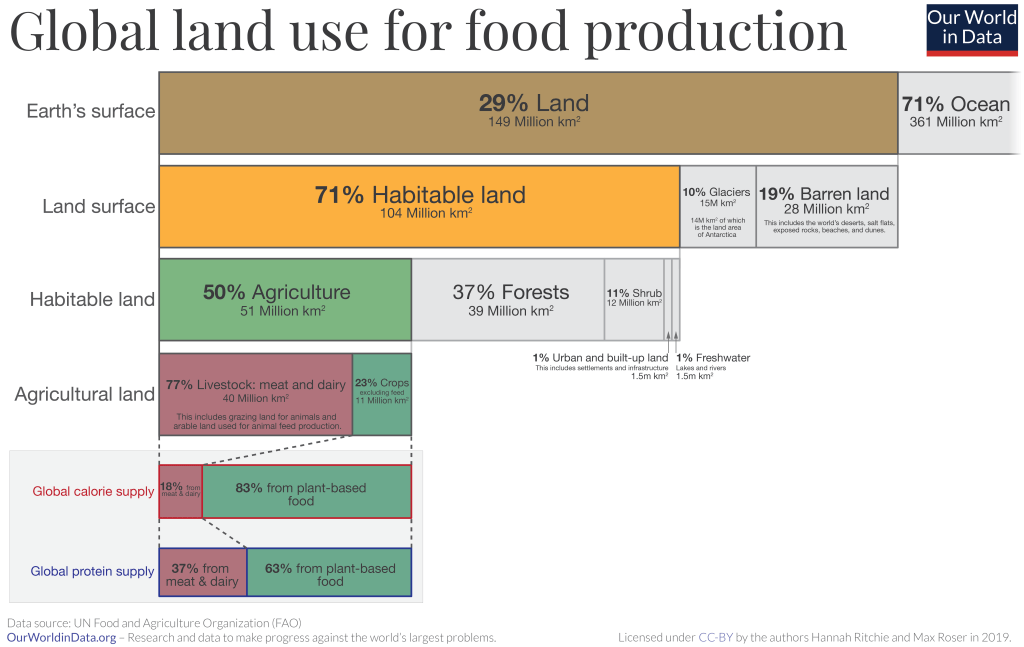
The following image provides for the global land use for food production. Note the global calorie supply and global protein supply.
According to World Health Organisation, the average global per capita food consumption (kilocalories per capita per day) in 2015 was 2940 kilocalories, which is projected to increase to 3050 kilocalories (Click here for more details).
Economic development is normally accompanied by improvements in a country’s food supply and the gradual elimination of dietary deficiencies, thus improving the overall nutritional status of the country’s population. Furthermore, it brings about qualitative changes in the production, processing, cold chain logistics, distribution, and marketing of food. The growth in food consumption has been accompanied by significant structural changes and a shift in diet away from staples such as roots and tubers towards more livestock products and vegetable oils. There has been an increasing pressure on the livestock sector to meet the growing demand for high-value animal protein. The world’s livestock sector is growing at an unprecedented rate and the driving force behind this enormous surge is a combination of population growth, rising incomes and urbanization. (Click here for more details).
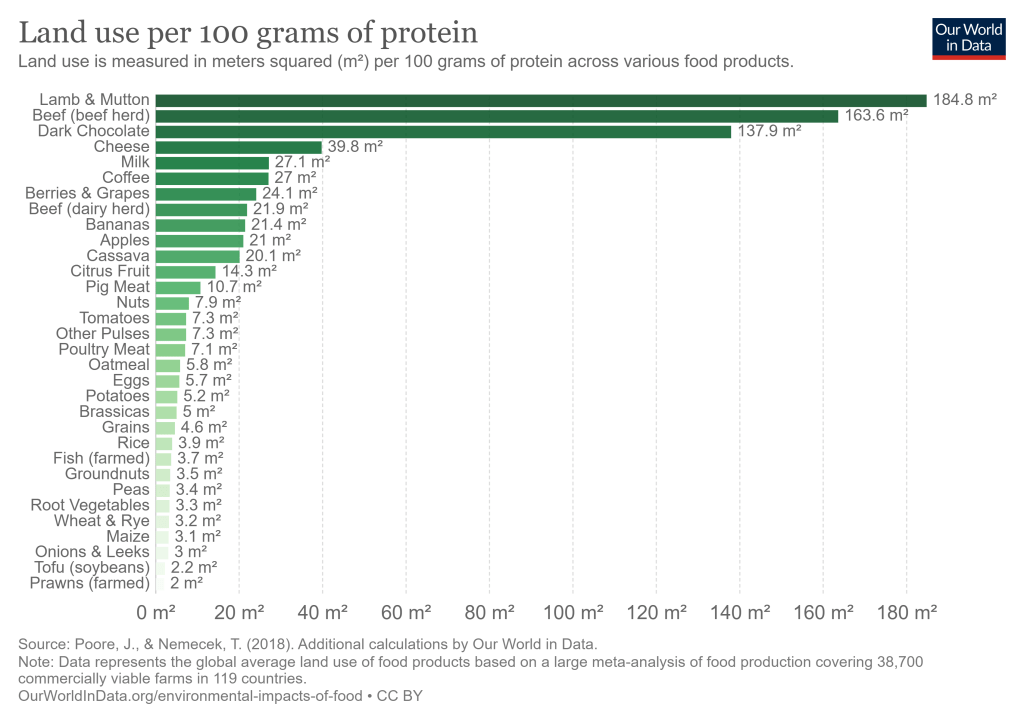
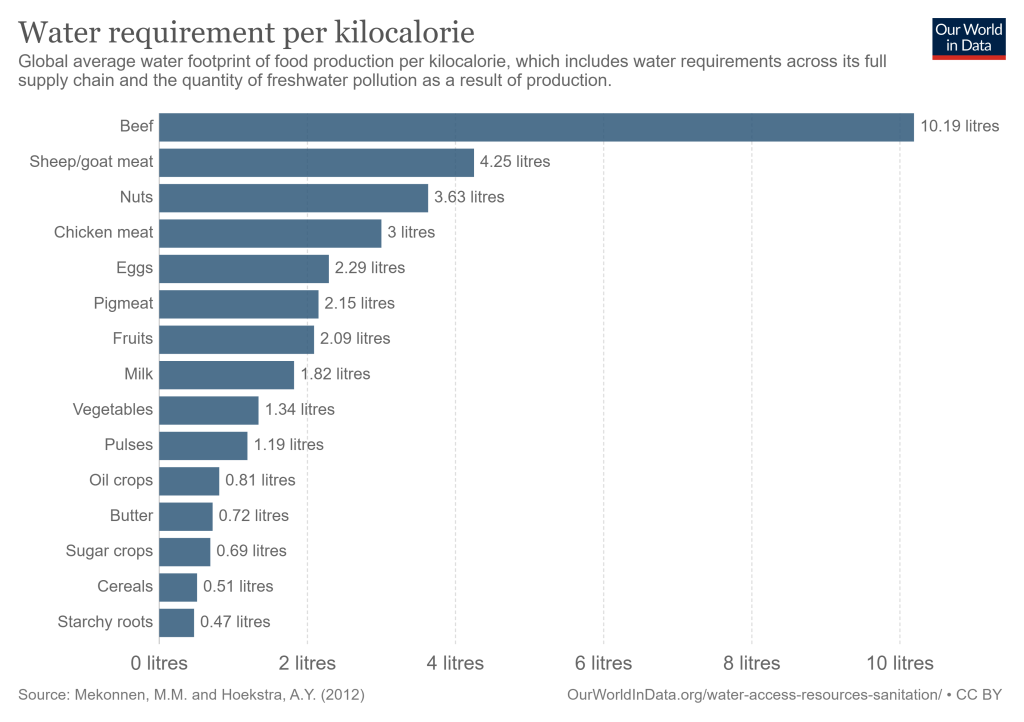
This has put land resources under tremendous pressures. Consider the land requirements for producing 100 grams of protein across various products.
There is a strong positive relationship between the level of income and the consumption of animal protein, with the consumption of meat, milk and eggs increasing at the expense of staple foods.
Annual meat production in world is projected to be about 376 million tonnes by 2030. The annual consumption of milk and meat in South Asia is expected to rise to 106.9 kg/capita and 11.7 kg / capita respectively in the year 2030 from previous figure of 67.5 kg/capita and 5.3 kg/capita in the year 1999.
The growing demand for livestock products is likely to have an undesirable impact on the environment. For example, there will be more large-scale, industrial production, often located close to urban centres, which brings with it a range of environmental and public health risks.
India is still far behind world average in food consumption and nutritional value. As per the Report of Nutritional Intake in India, 2011-12 (68th Round of National Sample Survey Office), the average per capita food consumption (kilocalories per capita per day) in India was 2233 and 2206 kilocalories in rural and urban areas, respectively. At the all-India level, protein intake per person per day was 60.7 grams in the rural sector and 60.3 grams in the urban sector. Average fat intake for the country was about 46 grams per person per day in the rural sector and 58 grams in the urban sector.
Table below shows the comparative data of average food consumption per capita per day in India with that of the world.
Average Food Consumption Per Capita Per Day in Grams (2011)
| Sr. No. | World | India | China | United States of America |
| Grain | 403 Rice (148), Wheat (179), Maize (48), Other (28) | 416 Rice (196), Wheat (161), Maize (18), Other (41) | 418 Rice (219), Wheat (174), Maize (20), Other (5) | 291 Rice (21), Wheat (218), Maize (34), Other (18) |
| Vegetables | 373 | 221 | 924 | 310 |
| Fruits | 203 | 141 | 221 | 266 |
| Milk | 247 | 220 | 85 | 704 |
| Egg | 24 | 7 | 51 | 38 |
| Meat | 173 Beef (26), Pork (42), Poultry (39), Seafood (52), Other Meat (14) | 29 Poultry (5), Seafood (16), Other Meat (8) | 254 Beef (13), Pork (98), Poultry (33), Seafood (89), Other Meat (21) | 381 Beef (101), Pork (76), Poultry (141), Seafood (59), Other Meat (4) |
| Sugar | 66 | 60 | 19 | 166 |
| Animal Fat | 9 | 8 | 6 | 14 |
| Vegetable Oil | 32 | 24 | 21 | 84 |
| Pulse | 19 | 39 | 3 | 9 |
| Total Consumption | 1878 | 1317 | 2368 | 2729 |
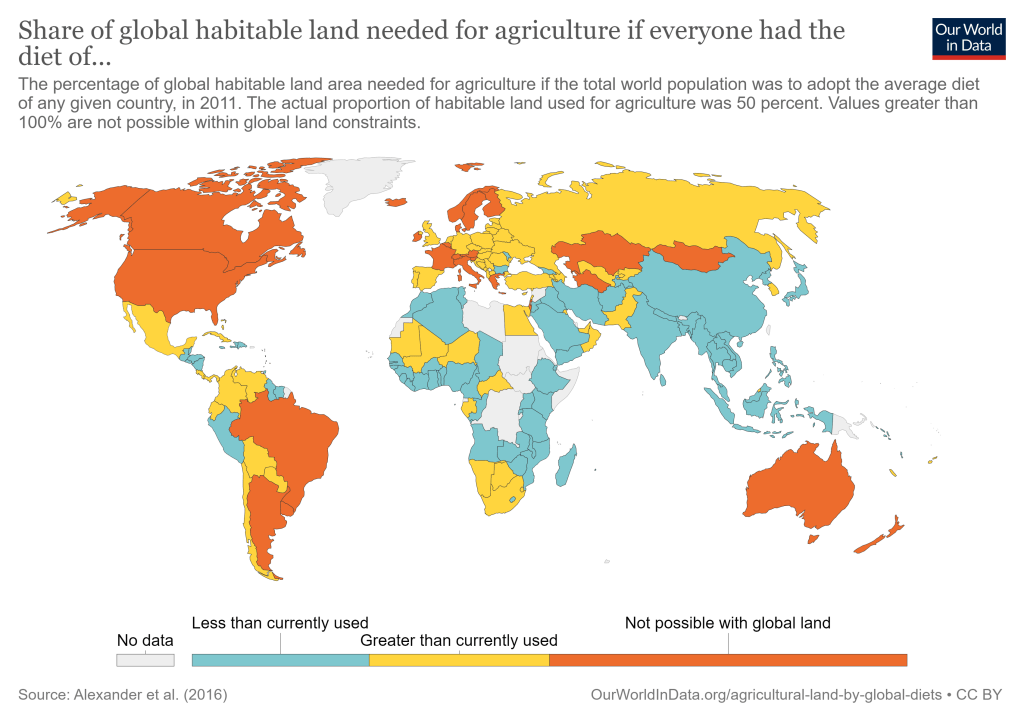
Can you imagine what will happen if the world starts following the diet patterns of a particular country? Say India or China or United States of America?
The following image will help us visualise the scenario.
To be more specific following graph compares a few countries as well.
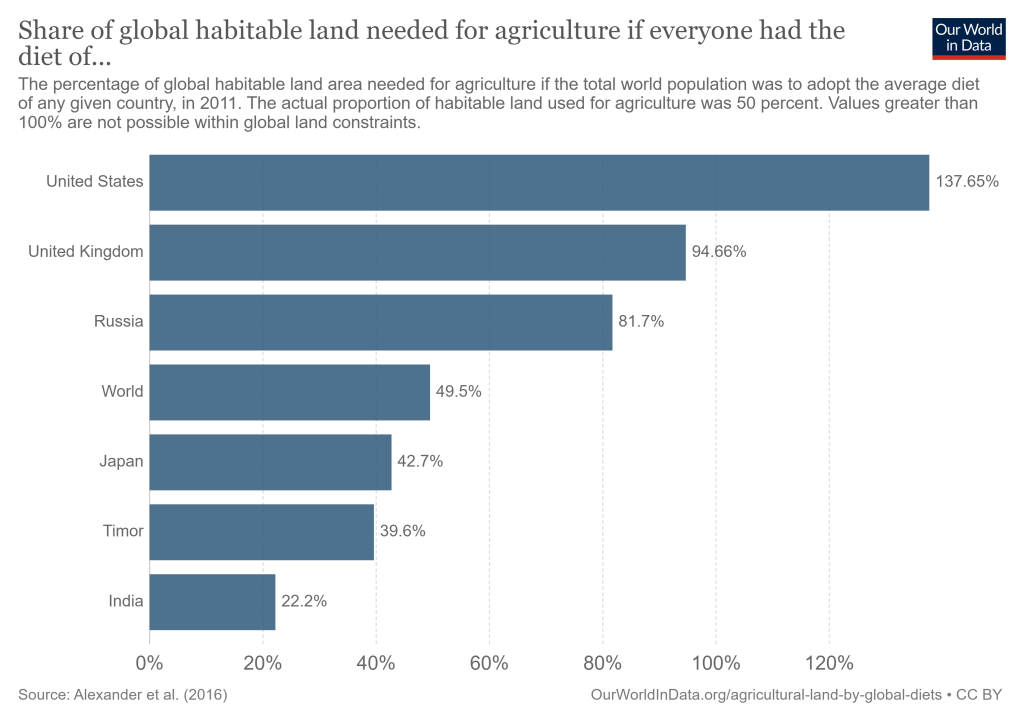
Of course, the world is not going to follow India’s diet pattern, we are still below global average calorie intake. Rather, India is catching up with the world average and possibly even higher.
With urbanisation levels in India expected to touch 55 per cent by 2050 (Click here to read more), the current Indian diet pattern is evolving. Successive governments in India are according high priority to the issue of malnutrition and growing demand for protein rich food with growing prosperity, it is evident that the pressure on agriculture, and livestock is slated to increase due to an increased demand for protein, fat and complex carbohydrate intake in the form of milk, pulses, vegetables, eggs, and other poultry / dairy / animal products.
According to Country Pasture/Forage Resource Profiles for India (FAO), the Indian grazing lands are classified as fragile eco-systems. The carrying capacity of these areas is 0.20 to 1.47 adult cattle units (ACU)/ha. In semi-arid areas, the stocking rates are 1 to 51 ACU/ha against the carrying capacity of 1 ACU/ha while in the arid areas, the stocking rates are 1 to 4 ACU/ha against the carrying capacity of 0.2-0.5 ACU/ha.
The deterioration of Indian pastures, grasslands and other grazing lands has been ascribed to the large bovine population, free grazing practices, lack of management, and natural constraints like extremes of temperature, steepness of slopes, variable precipitation, and scarcity of moisture in arid and semi-arid situations. (Click here to read more)
The demand for milk in India is likely to be in the range of 200-210 million tonnes in 2021-22. Annual average increase in milk production over the last 10 years was about 3.5 million tonnes per annum as against 6 million tonnes per year to meet the increasing demand. (Click here to read more).
Approximately 55 per cent per cent of land in India is put to agricultural use whereas the global average in 2018 was 37.43 per cent. Furthermore, India accounts for 18 per cent of world’s livestock population. 305 million bovines, and a total livestock of 512.06 million and 729.2 million poultry stock. In future, population of cattle, as also meat-supplying livestock like goat, sheep and pig is likely to grow further.
Although livestock is growing rapidly, grazing lands are diminishing and degrading due to pressures from agricultural and non-agricultural uses. The area under fodder cultivation is limited to about 4 per cent of the cropping area, and it has remained static for the last four decades. Owing to the importance of food crops and other cash crops, it is very unlikely that the area under fodder cultivation will increase substantially in future.
The Water Crisis
Agricultural land degradation (declining soil fertility, unsustainable water uses and drought) hits the poorest and most vulnerable communities the hardest. Rural poverty is often a direct consequence, and a driver of forced migration.
India accounts for over 17 per cent of world's population living on about 2.4 per cent of the world's geographical area and has access to less than 4 per cent of world’s fresh water sources.
India receives an average annual precipitation (including snowfall) of about 4000 Billion Cubic Metre (bcm). However, there are extensive spatial and temporal variations in its distribution and hence in availability of water in time and space across the country. It is estimated that out of the estimated 4000bcm of water, 1869bcm is the average annual potential flow in rivers available as water resource. The total utilisable water is only 1123bcm (690bcm from surface water resources and 433bcm from ground water resources). The water demand is estimated to be 1093bcm by the year 2025.
According to international norms, a country can be categorized as 'water stressed' when water availability is less than 1700 cubic metre per capita per year whereas classified as 'water scarce' if it is less than 1000 cubic metre per capita per year. The per capita availability of water has been steadily reducing from 5200 cubic metre in 1951 to 2309 cubic metre (in 1991), 1902 cubic metre (in 2001) to 1588 cubic metre (in 2010).It is projected that the per capita surface water availability is likely to further reduce to 1401 cubic metre and 1191 cubic metre by the years 2025 and 2050, respectively.
According to UN Thematic Initiative Report on (Coping with Water Scarcity), world over, agriculture accounts for 70 per cent of all water use, (as high as 95 per cent in several developing countries). To keep pace with the growing demand for food, it is estimated that on an average, 14 per cent more freshwater will need to be withdrawn for agricultural purposes in the next 30 years.
Consider the image below.
According to a study undertaken by International Water Management Institute and UN for the Government of India, water use share for India in agriculture, industries and domestic is 83 per cent, 12 per cent and 5 per cent as against the world average of 69 per cent, 23 per cent, 8 per cent and a European average of 33 per cent, 54 per cent and 13 per cent respectively.
The water sector in India is challenged by an increasing water demand and falling per capita availability, unacceptable levels of water use and energy efficiency, deterioration of water quality, reduction or deterioration of available resources (loss of surface storage), increasing competition/conflict within sectors, under and inefficient utilization of irrigation potential, over exploitation and depletion of ground water resources, water-logging and soil salinity in irrigated lands, fragmentation of management of water/ management of shared resources, lack of spatial inventory for large number of water infrastructure in the country, currently used water resources potential estimates are old, significant change in land use / land cover, demographic and utilization pattern in past few decades.
State of Forests
Land is the second largest carbon sink after the oceans. Restoring soils of degraded ecosystems has potential to store up to 3 billion tons of carbon annually. This is equivalent to storing up to 30 per cent of annual Carbon dioxide emissions from fossil fuel.
Look at the three visualisations below

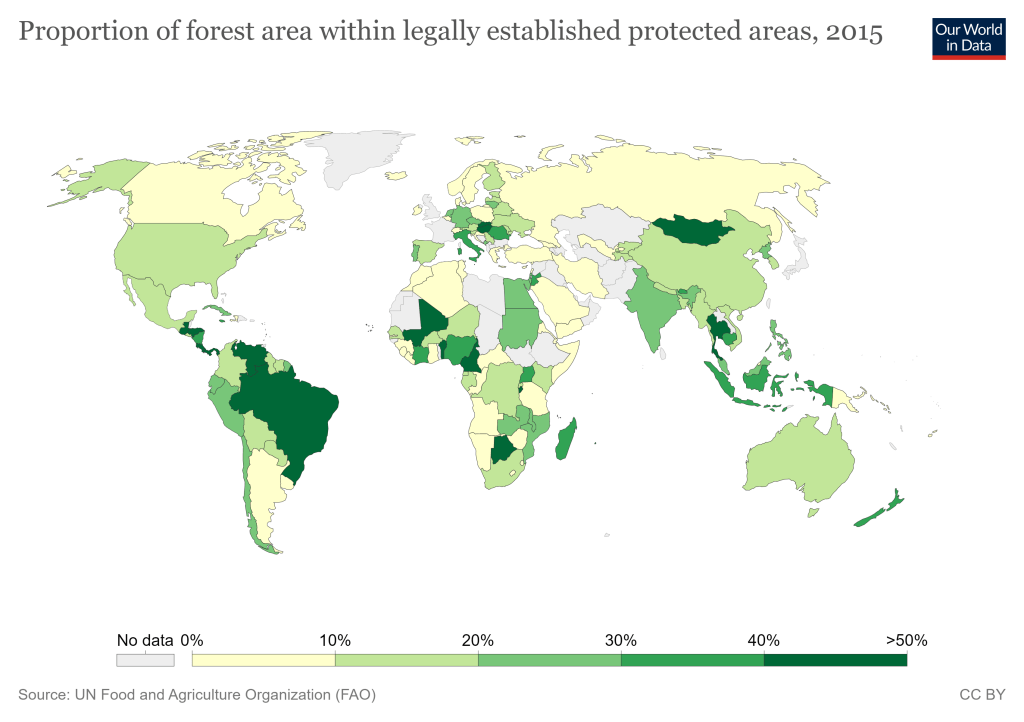
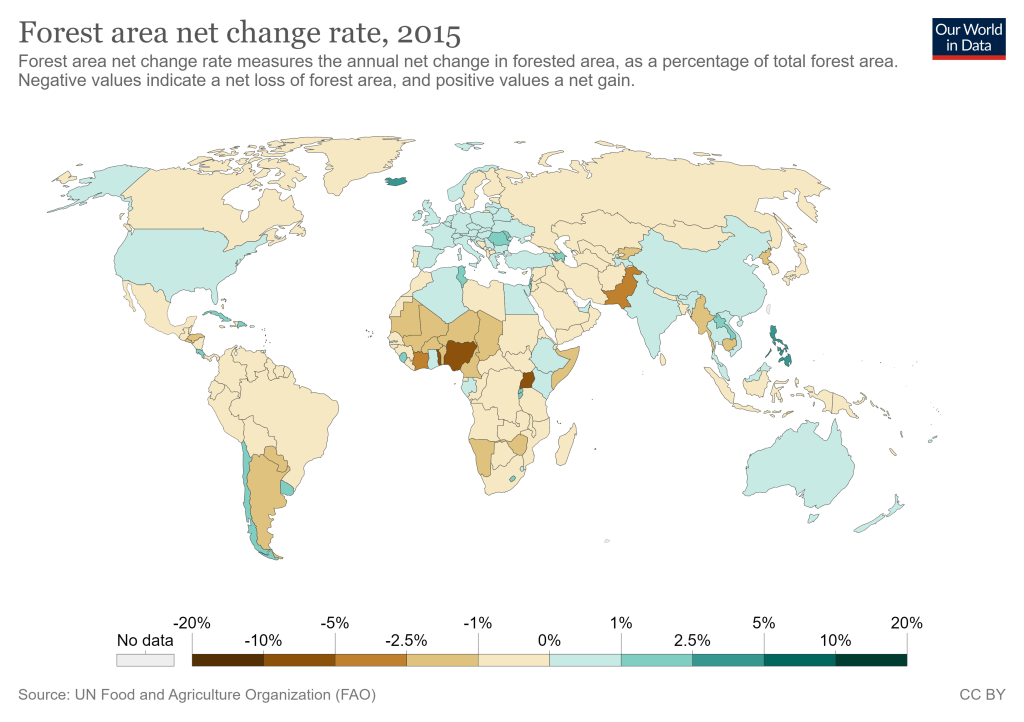
With most of the countries having a low share of forest as a percentage of land use, and even lesser area under forest having a legal protection status, it is anybody’s guess on what is going to happen to the global forest cover with very few countries showing a positive net change rate for forest area in 2015.
Forest Survey of India conducts a biennial assessment of India’s forest resources. Some of the key findings from the Indian State of Forest Report 2019 (Click here for more details) indicate following:
- The forest cover of India is 21.67 per cent and the tree cover outside forest is estimated at 2.89 per cent making the total forest and tree cover of 24.56 per cent of the total geographical area of India.
- It is estimated that there was an increase of 0.56 per cent of forest cover, 1.29 per cent of tree cover and a total of 0.65 per cent of forest and tree cover put together at the national level as compared to the previous assessment in 2017.
- Furthermore, the forest cover within the reserved forest area has shown a slight decrease of 0.05 per cent (330 square kilometres) as compared to previous assessment of 2017. The mangrove cover in has increased by 54 square kilometres (1.10 per cent) as compared to the previous assessment. However, 21.40 per cent of the forest cover of the country is classified as highly to extremely fire prone as per severity.
- The total carbon stock in forest in 2019 is estimated as 7,124.6 million tonnes (an increase of 42.6 million tonnes since 2017). The annual increase is 21.3 million tonnes, which is 78.1 million tonnes equivalent carbon dioxide (CO2eq).
The report categorically notes that the gain in forest cover or improvement in forest canopy density may be attributed to better conservation measures, protection, afforestation activities, tree plantation drives and agroforestry whereas, loss in forest covet and impairment of forest canopy may be attributed to shifting cultivation, forest fires, felling of trees, natural calamities, anthropogenic pressure and developmental activities.
Economic Development and Rural to Urban Migration in India
The per capita availability of agricultural land has declined from 0.5 hectares in 1951 to 0.15 hectares in 2011 and is likely to decline further. Furthermore, The report on State of Indian Agriculture 2015-16 by MoA&FW, GoI (click here for more details) indicates that the average size of operational land holdings in India has dropped from 1.33 ha in 2000-01 to 1.15 ha in 2010-11.
Let us have a look at the distribution of number of operational holdings for all social groups as per State of Indian Agriculture (2015-16)
| Sr. No. | Category | Percentage of Holdings (Average Size in hectares) 2000-01 | Percentage of Holdings (Average Size in hectares) 2005-06 | Percentage of Holdings (Average Size in hectares) 2010-11 |
|---|---|---|---|---|
| 1 | Marginal (Less than 1 ha) | 62.9% (0.4) | 64.8% (0.38) | 67.1% (0.39) |
| 2 | Small (1 to 2 ha) | 18.9% (1.42) | 18.5% (1.38) | 17.9% (1.42) |
| 3 | Semi Medium (2 – 4 ha) | 11.7% (2.72) | 10.9% (2.68) | 10% (2.71) |
| 4 | Medium (4 – 10 ha) | 5.5% (5.81) | 4.9% (5.74) | 4.2% (5.76) |
| 5 | Large (above 10 ha) | 1.0% (17.12) | 0.8% (17.08) | 0.7% (17.38) |
| All Holdings | 100% (1.33) | 100% (1.23) | 100% (1.15) |
The results of the NSSO’s Situation Assessment Survey of Farmers/Agricultural Households (2013) show that positive net monthly income, i.e., difference between income from all sources and consumption expenditure, accrues only to the farmers with land holdings of more than one hectare. It is, apparent that marginal holdings are too small to provide the farm household with adequate returns and incomes. This correlates with the World Bank estimates that 70 per cent of the Indian poor (approx. 770 million people) are from the rural area.
Agricultural sector India has shown less than 2 per cent per annum growth during the past decade. The share of agriculture and allied sector in GDP has come down sharply from 52 per cent in 1951-52 to 13.9 per cent in 2011-12, whereas, share in workforce remained high, declining to only 39.6 per cent from 54.6 per cent, during the same period. Such disconnection between employment growth and GDP growth is due to lack of non-farm employment.
Various schemes of government like ARYA (Attracting Rural Youth in Agriculture) and Skill India are expected to attract youth to secondary and tertiary sector, thereby increasing the pace of urbanisation.
At the urbanisation level of 31.16% (Census 2011), urban India’s contribution to the gross domestic product of India, was estimated to be about 63 per cent. With increasing urbanisation, 70 per cent of net new employment and 70-75 per cent of India’s gross domestic product is estimated to come from urban areas.
The migration of people from rural areas to urban areas is not restricted by the boundaries of states in India. Hence, urbanisation trends are more of a national phenomenon, and so are the secondary and tertiary sector economic opportunities generated by urbanisation and development projects.
Most States of India are already facing challenges in terms of balancing land allocation for developmental purposes. Judicious use of land resources has become foremost significant in all sustainable and developmental purposes. Some of the states are learning and improving their understanding of the importance of using spatial land use planning as a tool for guided development as compared to ad-hoc allocation of land for various development projects.
Land use planning is already being practised in several States of India, with many examples of urban areas, eco-sensitive zones, and economic and investment zones being guided by Land Use Planning. However, as the same is sporadic and in pockets, these plans lack efficiency, integration, and interaction with each other leading to constraints in successful implementation.
Integrated Spatial Land Use Planning is known to result in accrued benefits leading to Sustainable Development that finds the right balance between economic aspects (agriculture, mining, industries and commerce etc.), social aspects (urban as well as rural settlements, equity of distribution etc.) as well as the environmental aspects (natural resource management, disaster prevention and mitigation, forest, climate change etc.).
Such an integration of spatial and land use planning would need a legal backing.
Land and Constitution of India
According to the constitution of India, land is a State Subject as per Entries No. 18 and No. 45 in List II, State List. The power to enact laws concerning land vests with the State Legislatures.
However, some entries in List I, Union List and in List III, Concurrent List of the Seventh Schedule of Constitution of India provide necessary leeway to National Government for interventions in terms of projects in the form of strategic, economic, social, environmental corridors and zones of national importance passing across multiple states. Sometimes, these interventions are direct, but in the spirit of the constitution these are often incentive linked.
Some of the relevant entries in List I, Union List of the Seventh Schedule of Constitution of India are mentioned below:
- 22. Railways
- 23. National Highways
- 24. Shipping and navigation on inland national waterways
- 25. Maritime shipping and navigation
- 27. Major Ports including their delimitation
- 32. Property of the Union
- 53. Oilfields and mineral oil resources
- 54. Mines and mineral development
- 56. Interstate rivers and river valleys
- 67. Ancient and historical monuments and records, and archaeological sites and remains of national importance
- 81. Interstate migration
- 81. Interstate migration
- 87. Estate duty in respect of property other than agricultural land
Some of the relevant entries in List III, Concurrent List of the Seventh Schedule of Constitution of India include:
- 6. Transfer of property other than agricultural land
- 17A. Forests
- 20. Economic and Social Planning
- 36. Factories
- 41. Custody, management, and disposal of property (including agricultural land) declared by law to be evacuee property
- 42. Acquisition and requisitioning of property
- 45. Inquiries and statistics for the purposes of any of the matters specified in List II or List III.
Furthermore, the constitution of India also provides for integrated district level and metropolitan spatial land use planning. (74th Amendment, Article 243ZD for spatial planning for district and Article 243ZE for co-ordinated spatial planning for Metropolitan area).
Public Policy and Spatial and Land Use Planning
Public policies taking the form of master plans, primarily use spatial and land use plans and zoning and building code regulations as well as environmental regulations to affect land use. These instruments function by restricting usage of land but cannot influence how individuals and businesses would like to use land.
At the same time other policies and schemes (like, industrial, tourism, education, health, transportation, housing, agriculture etc.) – not related to land use planning systems, create incentives to use land in certain specific ways. However, it is not necessary that such policies correspond to best possible use of land for developing the state.
In many cases, the planning systems simply fail to achieve their objectives due to overwhelming pressures from contradicting land developments promoted by other policies.
Taking into account the sectoral development scenario, their issues and the new urban agenda, it is imperative to have State Land Use (Planning) Policy that provides a strategic and participatory framework for spatial integration of efforts of various sectors, minimise the inter-sector conflicts and ensure judicious use of scarce land to prioritise development, protect environment and conserve cultural heritage.
Furthermore, the New Urban Agenda (2016) recognises the correlation between, land, good urbanization, and development along with job creation, livelihood opportunities, and improved quality of life. The new urban agenda specifically emphasises on urban and rural interaction thereby advocating improvements in existing legislations, governance, and capacities.
A policy on Spatial and Land Use Planning can bridge this gap by bringing on board a multi-sectoral approach and ownership to ensure that the underlying themes / essence of various existing policies and guidelines of different sectors are captured and well represented in the proposed land use planning policy to ensure that synergy is achieved across various sectors.
Such a policy can serve as a spatial governance tool that guides balancing of considerations to all sectors and levels of governance by recognising interdependency of demographic and economic trends and linking national, sub-national/state level fiscal systems, schemes, projects that directly impact efficiency of land use.
A spatial and Land Use Planning Policy can also offer a common platform for decision makers to integrate sectoral concerns and tax policy incentives by strengthening regional considerations as part of planning and project conceptualisation.
If prepared, the policy can also address the 2030 Agenda for Sustainable Development which contains land-related targets. The policy would have a potential to positively impact achievement of 14 out of the 17 Sustainable Development Goals (SDG) due to its direct relation to 37 targets spread across SDG 1, 2, 3, 4, 6, 8, 9, 10, 11, 12, 13, 14, 15 and 16.
Want to see the SDG linkages to land use planning? Click here.

2 thoughts on “Chapter 04: Why Land Use Planning Policy?”