We are now well into the details for each sector. We have so much information on land use change and sectoral challenges. Let us spatially represent them and use the power of visualisation. We do this with two examples. This chapter is part of a series on Hierarchical Spatial Planning Framework
We have been working for the past 24 months now and undertaken an extensive study of our state. We have looked at the baseline scenario in terms of governance structure, department roles and their mandates, we have developed a good understanding of Land uses and its statistics for our state, we have also analysed the policies and strategies in detail.
We have also had extensive consultations with each actor and stakeholder. They have hopefully evolved to take-up part ownership of the upcoming policy now.
For this entire process we have been using the tool of visualisation extensively. Hence, the policies outcomes and outputs also need to be visualised better. Let us use a comfortable GIS platform and make spatial representation of all key outputs, outcomes and policies in the state.
Here I will try to explain with the two cases of Odisha and Tamil Nadu inter-spread with each other. Let us start.
Land Use
Let us start with the base map for Land Use Land Cover in the State.
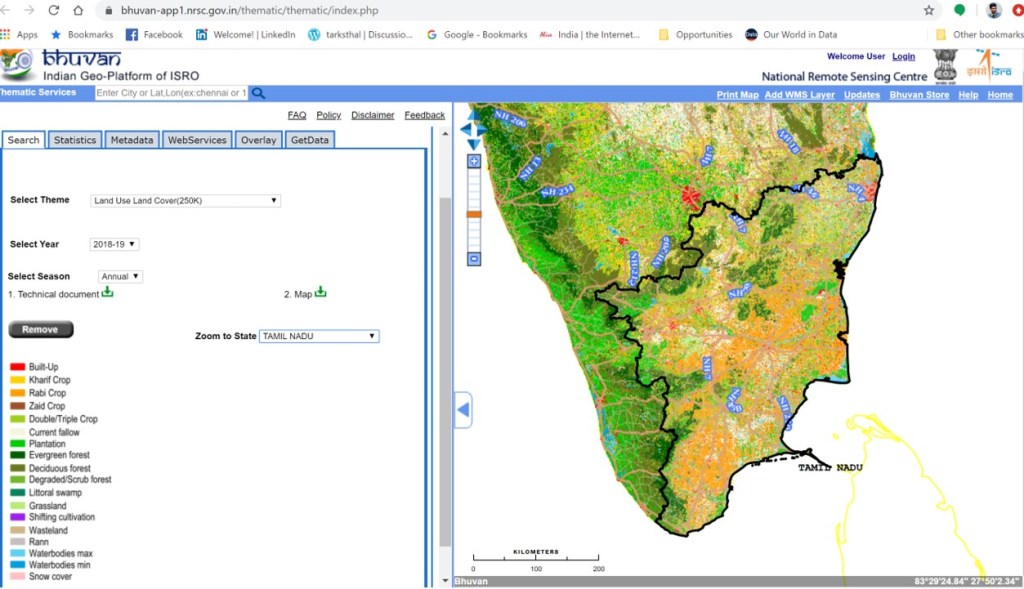
Have you heard of Bhuvan-Thematic Services developed by National Remote Sensing Centre, of Indian Space Research Organisation? Click here, here and here to know more.
The Bhuvan Thematic Services facilitate the users to select, browse and query the Thematic Datasets from this portal. Users can consume these Thematic Datasets and integrate into their systems as OGC Web Services. Once of these datasets include the spatial-temporal variations of Land Use Land Cover (2005-06 onwards) at scale of 1:250,000.
We can select the Land Use Land Cover (250 K) layer.

Select the Year

Select Season as annual and click view. Then we can zoom into a selected state.
If you want to view it in a GIS software of your choice, you can use Webservices link to get all the annual layers.

Or we can use their analysis or request data include satellite imagery and shapefiles.
While using the NRSC Bhuvan database for creating a base-map, the webservices link provides with an image of the land use land cover and not the shape files. To work on the shape files directly, one must approach NRSC and get permissions to access their servers and work in their premises. The final output can be carried out in the form of a PDF or Image.
It is recommended to get NRSC onboard to facilitate the data analysis. However, under time constrains, the webservices facility can be used to extract the image to an imaging software (like Adobe photoshop or GIMP etc.). The Layers can be separated by picking the colour pixels. Once separated the layers can be georeferenced and imported back to the GIS software as a pixelated image for each layer.
In the GIS software, the images can then be auto converted to polygon shape files (pixels) to get a land use map for analysis purposes. Though workable and quick, this process leads to errors (in our case we estimated an error possibility of about 10 per cent).
Following are a few points from the cases of Odisha and Tamil Nadu to understand the variations that need to be investigated from a state’s perspective. It is important to note that the seasonal variations are not highlighted now here.
Land Use in Odisha
Land use pattern in Odisha has undergone tremendous transformation over the past few decades due to the impact of urbanization, mining and industrialization. Changes in the land use pattern are associated with ecological changes. In Odisha, the estimated per capita availability of land is only 0.37 ha while the estimated per capita net sown area is only 0.11 ha.
A rough comparison estimate (error possibility of 10 per cent) of Land Use Land Cover maps for Odisha on a scale of 1:250,000, as available on Bhuvan portal (National Remote Sensing Centre’s programme) for the years of 2005-06 and 2016-17, indicates that the area classified as built up (including all settlements – urban or rural, mining, industrial, infrastructure including roads, railways, ports canals etc.) increased from about 2.44 per cent to 5.28 per cent showing a sharp increase of 2.84 per cent in absolute terms. During the same period, area under water bodies (post monsoons) reduced by 0.26 per cent in absolute terms from 4.13 per cent to 3.87 per cent.

Furthermore, the total cropped areas increased from 30.39 per cent to 36.16 per cent (a stupendous increase of 5.77 per cent in absolute terms) whereas the net sown area showed an even higher increase of 5.87 per cent in absolute terms from 31.05 per cent to 36.92 per cent over the years of 2005-06 and 2016-17. During the same period, the current fallows shows a drastic reduction of 8.98 per cent in absolute terms from 13.20 per cent to 4.22 per cent. Interestingly, the total area under double or triple cropping shows only a marginal increase of 0.10 per cent in absolute terms and the area under rabi season showed an increase of 0.30 per cent in absolute terms, thereby increasing its share to 0.32 per cent, strongly indicating heavy dependence on monsoon and very less utilisation of irrigation facilities.
According to the India State of Forest Report (2017), the total forest and tree cover in Odisha accounts for about 41.87 per cent of which 2.56 per cent is accounted by trees outside forests of its total geographical area with a net increase of 885 sq. km. in the forest cover of the State attributed to plantations and conservation efforts within Recorded Forest Areas.
The National Wetland Atlas: Odisha jointly prepared by Space Application Centre (ISRO), Ahmedabad and Odisha Space Application Centre, Bhubaneshwar (September 2010) estimates that Odisha has about 78440 wetlands. The total wetland area is estimated to be 690904 ha accounting for about 4.47 per cent of Odisha’s total geographical area.
It is further estimated that there are 3111 inland natural wetlands and 7871 inland man-made wetlands accounting for approximately 34.57 per cent and 31.87 per cent of the total area under wetlands, respectively. Whereas 560 coastal natural wetlands account for about 20.84 per cent and 724 coastal man-made wetlands account for about 3.14 per cent of total area under wetlands. In addition to these, it is estimated that there are about 66174 small wetlands (< 2.25 ha) accounting for the balance 9.58 per cent of the total area under wetlands.
Land Use in Tamil Nadu
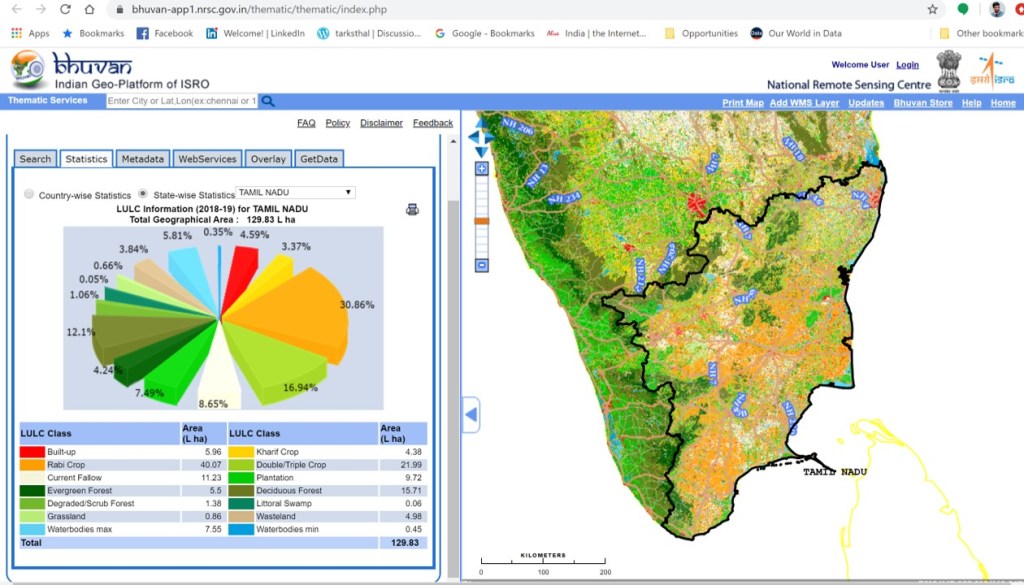
Land use pattern in Tamil Nadu has undergone tremendous transformation over the past few decades due to the impact of urbanization and industrialization. Changes in the land use pattern are associated with ecological changes. In Tamil Nadu, the per capita availability of land is only 0.18 ha while the per capita net sown area is only 0.07 ha.

A rough comparison estimate (error possibility of 10 per cent) of Land Use Land Cover maps for Tamil Nadu on a scale of 1:250,000, as available on Bhuvan portal (National Remote Sensing Centre’s programme) for the years of 2005-06 and 2016-17, indicates that the area classified as built up (including all settlements – urban or rural, industrial, infrastructure including roads, railways, ports canals etc.) increased from about 2.82 per cent to 4.02 per cent showing a sharp increase of 1.2 per cent in absolute terms. During the same period, area under water bodies (post monsoons) reduced by 1.12 per cent in absolute terms from 6.4 per cent to 5.28 per cent possibly indicating weak monsoons in 2016-17. Furthermore, the total cropped areas reduced from 53.69 per cent to 50.72 per cent (a decrease of 2.97 per cent in absolute terms) whereas the net sown area showed relatively smaller reduction of 0.7 per cent in absolute terms from 34.94 per cent to 34.24 per cent over the years of 2005-06 and 2016-17. During the same period, the current fallows shows an increase of 2.34 per cent in absolute terms from 20.17 per cent to 22.51 per cent. Interestingly, the total area under double triple cropping showed a reduction of 2.28 per cent in absolute terms and the area under rabi season showed an increase of 2.25 per cent in absolute terms, possibly indicating a weak monsoon but higher dependence on irrigation facilities.
According to the India State of Forest Report (2017), the total forest and tree cover in Tamil Nadu accounts for about 23.80 per cent of its total geographic area with a net increase of 73 sq. km. in the forest cover of the State attributed to plantations and conservation efforts within Recorded Forest Areas.
The National Wetland Atlas: Tamil Nadu jointly prepared by Space Application Centre (ISRO), Ahmedabad and Institute of Remote Sensing, Chennai (May 2010) estimates that the Tamil Nadu has about 42978 wetlands. The total wetland area is estimated to be 902534 ha accounting for about 6.92 per cent of Tamil Nadu’s total geographic area.
It is further estimated that there are 4609 inland natural wetlands and 19480 inland man-made wetlands accounting for approximately 50.64 per cent and 33.78 per cent of the total area under wetlands, respectively. Whereas 404 coastal natural wetlands account for about 9.83 per cent and 191 coastal man-made wetlands account for about 3.73 per cent of total area under wetlands. In addition to these, it is estimated that there are about 18294 small wetlands (< 2.25 ha) accounting for the balance 2.03 per cent of the total area under wetlands.
Urbanisation and Spatial Growth Directions
We have seen that urban areas are increasingly becoming the growth engines of Indian economy. Furthermore, the settlement pattern and growth directions of urbanisation are the foremost reasons for arising of conflicts between two land uses, sectors, or human activities and natural environment. Hence, it becomes important to understand how the settlement pattern in a state has evolved over time and which are the current hot spots of rapid development.
We will again look at the two cases of Odisha (one of the least urbanised states in India) and Tamil Nadu (one of the most urbanised states in India).
Spatial Growth Patterns for Odisha
Early Historic Urbanisation
The emergence of Odisha and its urbanisation is regarded as an extension process of the ‘Second Urbanisation’ or the ‘Early Historic Urbanisation’ in the Gangetic plains of India’ i.e. the period from 600 BC to 500 AD (Ghosh 1973; Sharma 1991, Makhan Lal 1984; Ray 1986; Erdosy 1988; Allchin 1989: 1-16; 1990: 163- 173; 1995; Chakrabarti 1995; Champakalaxmi 1996). With the early historic urbanisation accelerating during the Mauryan Period, with decentralised administration based on Kautilya’s principle of policy, cities started flourishing as inland and oversees trades influenced changes in social and economic fabric. This propelled Mahanadi and Brahmani Deltas along with Middle Mahanadi and Tel Valleys into urbanisation. As trade increased the port complexes of Manikapatana, Palur and Radhanagara started gaining prominence.
Further on occupational specialisations including gem exploitation, iron smelting, craft (especially terracotta) and production of artifacts like pottery, beads, metal items, coins etc. led to emergence of fortified urban centres with extensive planning and technology applications in the form of Sisupalgarh in Khurda, Jaugada in Ganjam, Radhanagara in Jajpur, Viratgarh and Kichakgarh in Mayurbhanj, Narla-Aurgarh, Budhigarh and Kharligarh in Kalahandi and Manamunda-Asurgarh in Boudh districts of present day Odisha. (Lal 1949:62-105; IAR 1956-57:30-31; Sahu 1982; 1-8, IAR 1990; Pradhan 1995: 26-28; Mishra 1997; Mishra 2000: 507-549; Tripathy 2002; Mohanty and Mishra 2005: 97-124)
Urbanisation in Medieval Odisha
With the emergence of urban centres like Pithunda, Palura, Kjhalkattapatana, Konarka, Puri Kataka etc. having predominant functions of administration, pilgrimage or trade, Odisha’s urban centres gained international prominence. With Mughals, the commercial activities and trade shifted from southern ports to northern region as Pipli, Balasore, Harishpur and Hariharpur gained significance. With the advent of European influence and British occupation of Eastern Odisha and rise of Calcutta fleet, commercial and trade centres witnessed decline. (PP Mishra, Urbanisation in Medieval Odisha).
Urbanisation in Pre-Independence and Post-Independence Odisha
Historically, municipalities in Odisha came into being under the Bengal Presidency. After its separation form Bengal in 1912, the towns of Kendrapada, Cuttack, Sambalpur and Balasore emerged as municipalities in the Bihar Orissa Presidency. Carved out of Madhya Pradesh, Bihar and Madras presidency, in 1936, the special state of Orissa, had only 8 municipalities in the form of Berhampur (since 1855), Cuttack (since 1867), Jajpur and Kendrapada (since 1869), Balasore (since 1877), Puri (since 1881), Sambalpur (since 1883) and Paralakhemundi in Gajapati (since 1886) and an urbanisation level of only 3% in the census of 1941. With the merger of princely states in Odisha in 1948-49, the urban local bodies increased to 29.
After independence, and with the adoption of the Odisha Municipality Act (1950) and subsequent acts, amendments and ordinances in 1990, 1991 and 1992 supporting revival of municipal bodies, the growth of towns and urban areas increased in Odisha with the census 2011 recording about 221 towns of which 107 towns are statutory.
Recent Urbanisation and Population Trends
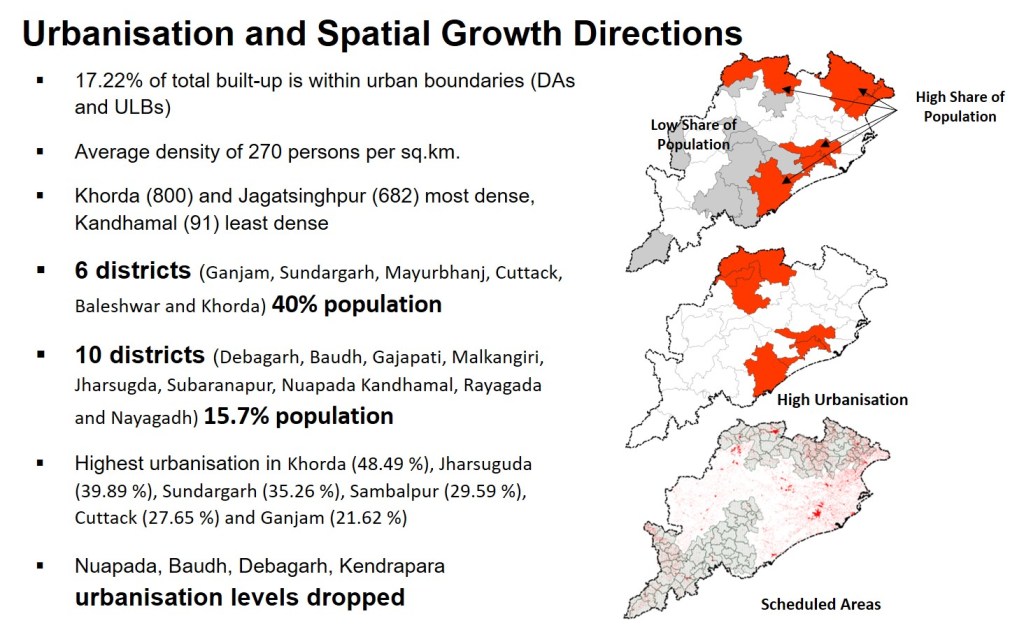
The urbanisation level in Odisha is one of the lowest as compared to rest of the country. With 16.69 per cent of urbanisation level accounting for about 17.22 per cent of the total built-up area, the overall population density (persons per sq. km.) according to Census 2011 works out to be 270, with Khurda (800 persons per sq. km.) representing the most dense followed by Jagatsinghpur (682 persons per sq. km.) both in 2001 and 2011 Censuses. The lowest density of population is recorded in Kandhamal district (91persons per sq. km.) for both the censuses.
The state has been witnessing a rise in population since 1951, however, the overall rate of growth stabilised during 1981-1991 and has been declining since then. Despite a rapid growth of population observed in the southern and central districts of Odisha, the concentration of population remains towards northern and coastal districts (Census of India 2011).
The distribution of population across Odisha is not even. Whereas six districts (Ganjam, Sundergarh, Mayurbhanj, Cuttack, Baleshwar and Khurda) account for nearly 40 per cent of the state population, the districts of Debagarh, Boudh, Gajapati, Malkangiri, Jharsuguda, Subarnapur, Nuapada Kandhamal, Rayagada and Nayagarh account for 15.7 per cent of the state population. The districts of Subarnapur, Balanagar and Malkangiri witnessed highest population growth rates (more than 20 per cent) followed by Nabarangpur, Khurda (between 18 per cent to 20 per cent) during 2001-2011.
The presence of capital city of Bhubaneshwar, ensures that the district of Khurda has the highest urban population with about 1.1 million people living in urban areas, followed by the districts of Ganjam (0.76 million), Sundergarh (0.74 million), Cuttack (0.72 million), Puri, Baleshwar, Kendujhar and Jharsuguda (approximately 0.25 million each). The district of Ganjam has largest rural population of with 2.76 million people living in rural areas followed by Mayurbhanj (2.32 million), Baleshwar (2.06 million), Cuttack (1.89 million), Jajpur (1.69 million), and Kendujhar, Kalahandi, Bolangir and Puri (approximately 1.5 million each).
The urbanisation levels are observed highest in the districts of Khurda (48.49 per cent), Jharsuguda (39.89 per cent), Sundergarh (35.26 per cent), Sambalpur (29.59 per cent), Cuttack (27.65 per cent) and Ganjam (21.62 per cent). Rest of the districts show a lower urbanisation level than the state average of 16.66 per cent as per Census 2011. In case of Nuapada, Boudh, Debagarh, Kendrapada, the level of urbanization has dropped between 2001 and 2011.
Scheduled Areas
Odisha occupies a unique position among the Indian States and Union Territories for having a rich and colourful tribal scenario. Majority of scheduled tribes live in its hilly and forest regions. Their economy is largely subsistence oriented, non-stratified and non-specialized. Their social systems are simple, and aspirations and needs are limited. Though the scheduled tribes in Odisha have suffered from social, educational and economic backwardness due to geo-historical reasons, they have their own distinctiveness and social-cultural milieu.
There are 62 different tribal communities including 13 Particularly Vulnerable Tribal Groups (PVTGs) in the State. In numerical terms Odisha has the third largest concentration of tribal population in the country after Madhya Pradesh and Maharashtra. About 44.70% of the State’s geographical area constitutes for Scheduled Area and extends over 118 out of 314 Blocks in 12 districts and a portion of Suruda Tahsil of Ganjam District.
In exercise of powers conferred by sub-paragraph 6 of the Fifth Schedule to the Constitution of India, the revised Presidential Order titled ” The Scheduled Areas (states of Bihar, Gujarat, Madhya Pradesh & Odisha) Order 1977″ has declared the full districts viz. Mayurbhanj, Sundergarh, Koraput (which now includes the districts of Koraput, Malkangiri, Nabarangapur and Rayagada) , Kuchinda tehsil of Sambalpur district, Keonjhar, Telkoi, Champua, Barbil tehsils of Keonjhar district, Khondamal, Balliguda and G.Udayagiri tehsil of Khondamal district, R.Udaygiri tehsil, Gumma and Rayagada block of Paralakhemundi tehsil in Paralakhemundi Sub-division and Suruda tehsil (excluding Gazalbadi and Gochha Gram Panchayats), of Ghumsur sub-division in Ganjam district, Thuamul Rampur and Lanjigarh blocks of Kalahandi district and Nilagiri block of Balasore district as Scheduled Areas of the state. After reorganisation of districts in the state in the year 1992-93, seven districts fully and six districts partly are covered under the Scheduled Areas of the state.
The state has adopted the area development-based approach in the form of Tribal Sub Scheme Strategy as the Tribal Sub Plan since 1974-75. The Tribal Sub-Scheme area in Odisha consists of 119 Blocks including Tileibani block of Deogarh District which has been declared as TSP block by Govt. of India during 2015. The scheduled tribe population of scheduled area accounts for about 68.09 per cent of total tribal population of the State. The remaining schedule tribe population inhabit in Modified Area Development Approach (MADA) Pockets, Cluster Approach Pockets (CAPs) or are dispersed in other areas that are covered under the Dispersed Tribal Development Programme (DTDP).
Other than Sundergarh and Sambalpur, all other districts which are declared as scheduled districts as per the constitutional provision have low levels of urbanization.
Spatial Growth Patterns for Tamil Nadu
Pre-Independence
Historically, Tamil Nadu has been in the forefront of urbanization. Tracing the political regimes of Chera, Chozha, Pandya and Pallava Kingdoms (Champalakshmi, 2010), Tamil Nadu saw growth of 186 urban centres categorised as Royal Centres (Mandalams/Tinais/Nadu in the form of regions of Kar Mandalam, Tondai Mandalam, Kongu Mandalam, Chola Mandalam and Pandya Mandalam), Brahmadeyas (Taniyurs), Nagaram (Trade centres or centres of Merchant Bodies) and Pattinams (port towns and coastal towns) during the first two millenniums. These were characterised by emergence of weaving centres like Kancheepuram, Bhavani, Arani, Erode and port towns like Mamallapuram, Nagapattinam, Kaveripattinam, Pudupattinam, Cuddalore, Tondi and Korkai.
Invasions of neighbouring kingdoms (Marathas, Chalukyas and others) led to emergence of metropolitan and cosmopolitan urban centres such as Thanjavur. Post 1900s, occupation by colonisers led to development of French and British port and canal towns. Focus on trade routes to interiors led to development of hill towns (Ooty, Kodaikanal, Connoor) and railway towns (Junctions).
Post-Independence
In the post-independence era, agglomerations picked up pace of development compared to independent towns. Post 1991, the urbanisation in Tamil Nadu has taken huge leaps with rapid rise of Class I towns and Class IV, V, VI towns and census towns.
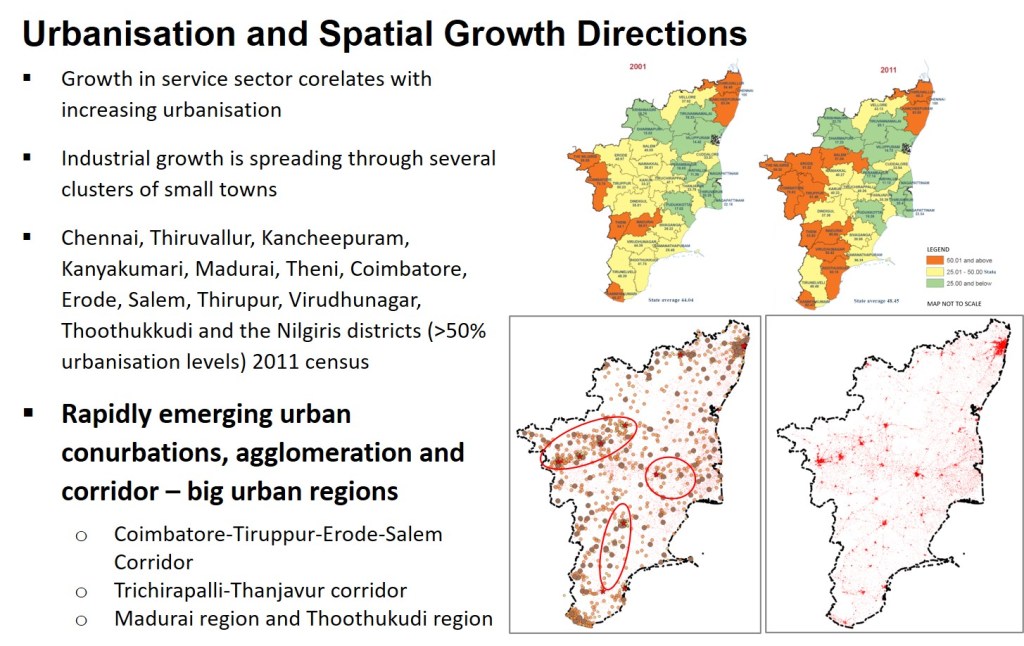
Back in 2001, most of the urbanised areas were concentrated towards edges of the state with Chennai, Thiruvallur, Kancheepuram, Kanyakumari, Madurai, Theni, Coimbatore and the Nilgiris districts having urbanisation rates of more than 50 per cent. However, by 2011, districts like Erode, Salem, Thirupur, Virudhunagar and Thoothukkudi also rose to the above 50% category of urbanisation.
The rate of urbanization is seen with a sharp fall in the share of agricultural sector to net state domestic product of Tamil Nadu from 52 per cent in 1960-61 to 18 per cent in 2007-08 to 8.2 per cent in 2010-11. 92 per cent of agricultural landholdings in Tamil Nadu belong to small and marginal farmers and employs about 40 per cent of the workforce. Coupled with negative growth rates in the share of agricultural labour and farmers, emergence of increased focus on industries and service sector has resulted in an increase migration from rural to urban areas.
Recent Trends
Regarded as its growth engine, service sector is a major contributor to GSDP of Tamil Nadu. With its share consistently above 60 per cent in the past decade, while the share of manufacturing and agriculture averaged about 28 per cent and 9 per cent.
Modern services sector is surging rapidly in Tamil Nadu as it ranks second next to Karnataka in export of ICT services. This growth of services sector directly correlates with the increasing urbanisation. For instance, some of the services sector giants which were earlier housed in Chennai have expanded and set up offices in Kanchipuram, Thiruvallur and Chingleput districts.
Tourism and road connectivity are proving to be important contributors to the services sector as Tamil Nadu tops the list of states in India with highest tourist arrivals both domestic and international consecutively in the last three years. Roads in Tamil Nadu very well connect the tourist destinations, urban centres and industrial locations, covering about 153 km per 100 sq. km.
According to the Annual Survey of Industries 2015-16, Tamil Nadu ranks first in terms of number of factories, number of factories in operation and total persons engaged. It ranks third next to Maharashtra and Gujarat in terms of output and gross value added. The state is home to nearly 40 per cent of India’s total automobile industry. Tamil Nadu has attracted foreign direct investments, particularly in auto telecom and hardware sectors including global majors.
Industrial growth in Tamil Nadu is spreading through several clusters located in small towns of the state that specialise in a range of activities like textiles to auto components making.
The fast rate of urbanization has triggered conurbations, agglomeration and corridor development leading to big urban regions within the state. For example, Coimbatore-Erode-Salem Corridor has been on the limelight because of heavy industrial development and emerging as a big industrial investment hub. Similarly, Trichirapalli-Thanjavur corridor, Madurai region and Thoothukkudi region are also emerging rapidly.
Key Challenges
A macro-economic study for the state needs to be undertaken to understand the key challenges that need to be addressed by the land use planning policy. Focussed macro-economic studies were undertaken from the perspectives of the each of the sectors mention in previous chapter, for both the states in our case. The key challenges were identified and are being presented below.
Each state has its’ own macro-economic challenges. It is important to understand the spatial implication of these challenges.
Following are a few points (indicative only, not limited to) from the cases of Odisha and Tamil Nadu to understand the issues that need to be investigated from a state’s perspective.
Socio-Economic Challenges
Socio Economic Challenges in Tamil Nadu
With the absolute number and percentage of cultivators declining from 1991 onwards (possibly due to farmers leaving farming/selling their land), Tamil Nadu is the only state in India which has registered a negative growth in employment in agriculture since 1990s (Vijayabaskar, 2010). Possibly, they are working as agricultural labour as absolute numbers in this category is increasing.

Evident from statistics for the districts of Chennai, Salem, Theni, Madurai and the Nilgiris, higher levels of urbanisation are not necessarily translating into higher per capita income. Similarly, whereas the districts of Krishnagiri, Dharmapuri, Perumbalur, Ariyalur, Thanjavur and Ramananthapuram with very low level of urbanisation show very high poverty, level of urbanisation is not necessarily translating into freedom from poverty for people in districts like Namakkal, Salem, Karur, Dindigul, Theni and Virudhunagar which show higher Multi-Dimensional Poverty Index despite relatively higher rate of urbanisation.
Issues like less opportunities in the secondary and tertiary sector, declining agriculture, unequal distribution of income within the district, poor quality of jobs, educated unemployment, high levels of in-migration need to be addressed to ensure balanced development.
Socio Economic Challenges in Odisha
The growth rate of Gross State Domestic Product (GSDP) of Odisha has been oscillating as compared with growth rate of Gross Domestic Product (GDP) of India. The state has showed signs of significant improvement post 2016. Whereas, contribution of agriculture to GSDP has declined over the past decades, the contribution of service sector (trade, tourism allied services, transport and communication, housing, real estate and other social infrastructure, and financial and professional services public administration etc.) has increased from 34.6 per cent to about 39.3 per cent from 1990-91 to 2016-17. The contribution of secondary sector (including subsectors of industry, manufacturing, mining and quarrying, electricity, gas, water supply and utility services and construction) during the same period has increased from 39 per cent to 53.6 per cent.
This is not reflected in change in employment pattern with about 62 per cent of total workers still engaged in agricultural activities.
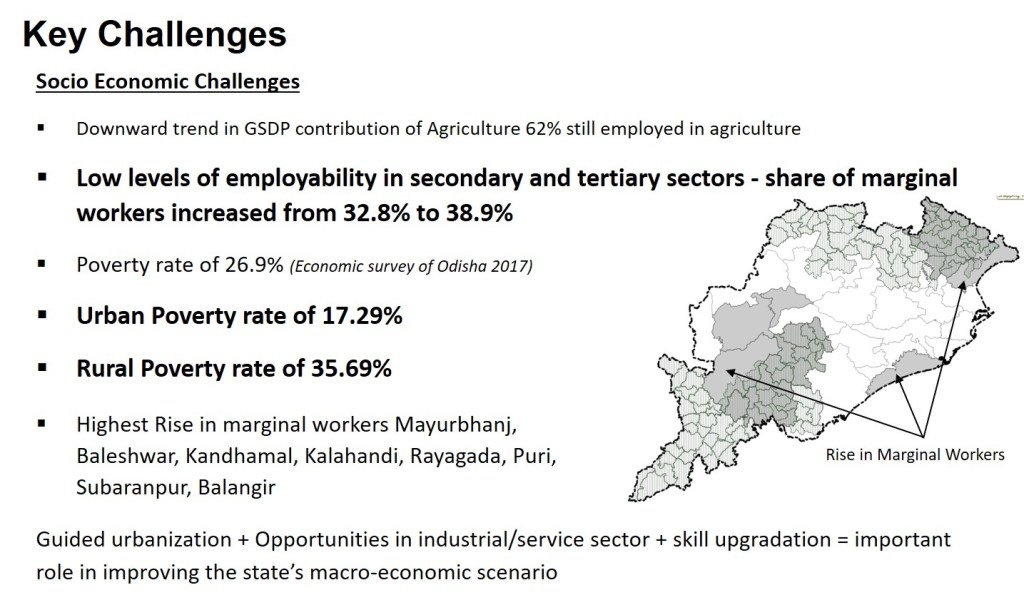
Whereas, there has been a growth of total workers at a rate of 22.9 per cent between 2001 and 2011, the share of marginal workers has increased in all districts with the state level share increasing from 32.8 per cent to 38.9 per cent during the same period indicating low employability in service and industry sectors which holds high share of GSDP.
During the same period, there has been a reduction of approximately 0.14 million cultivators and an increase of 1.74 million agricultural labourer, indicating that increasing number of people have lost their land and being low skilled are not being absorbed in other non-agricultural sector, leading to high out migration to other states.
The most significant rise in marginal workers is in the scheduled districts of Mayurbhanj (15.4 per cent), Baleshwar (8.7 per cent), Kandhamal (10.5 per cent), Kalahandi (11.4 per cent), Rayagada (13.8 per cent) with lowest levels of urbanisation. In addition to these, the districts of Puri (10.4 per cent), Subaranpur (by 29.3 per cent), Bolangir (by 32.6 per cent) also show significant rise in marginal workers.
Though unemployment in Odisha has declined from 5.1 per cent in 2012-13 to 3.8 per cent in 2015-16, against all India average of 3.7 per cent, the incidence of unemployment among females is extremely high at 6.6 per cent as against all India average of 5.8 per cent in 2015-16.
It is dichotomous that Odisha being a mineral, soil, and water rich state still fares at 23rd rank among other states and union territories in India with 32.59 per cent people below poverty line as of 2011-12 reducing from 57.61 per cent (click here to read more). The Economic Survey of Odisha (2017-18) estimates that the poverty rates have further reduced to 26.9 per cent by 2017. It is important to note that the incidence of poverty is much lower in urban areas (17.29 per cent people below poverty line) as compared to rural areas (35.69 per cent people below poverty line).
Clearly, the issue of guided urbanization with opportunities in industrial and service sector along with initiatives for skill upgradation would play an important role in improving the state’s macro-economic scenario.
Water Constraints in Tamil Nadu
With approximately four per cent of India’s land area and six per cent of population, Tamil Nadu is a water deficit state with only 2.5 per cent of India’s water resources. The total assessed water resources in the state amount to 1587 TCM as against a demand estimate of 1894 TCM, an alarming shortage of 19.3 per cent when rainfall is ‘normal’, the water deficit is more of a structural deficit rather than seasonal deficit.
Tamil Nadu has 17 major river basins of which Cauvery is the only major basin, whereas 13 are medium and 3 are minor river basins. (Shown in image)
The utilisable groundwater recharge is 22,423 MCM. The current level of utilisation expressed as net ground water draft of 13,558 MCM is about 60 % of the available recharge, while 8875 MCM (40 %) is the balance available for use. Over last five years, the percentage of safe blocks has declined from 35.6 % to 25.2 % while the semi-critical blocks have gone up by a similar per centage. About 40% of the land mass of Tamil Nadu has over exploited underground water status while only 36% land area was deemed to be safe as per 2013 data.

The red hatches in image show areas with rapid aquifer decline whereas the blue hatches denote the areas where aquifer has shown a rise.
More than 95 per cent of surface water and 80 per cent of ground water is already being put into use. Major uses of water include human/animal consumption, irrigation and industrial use wherein agriculture is the largest consumer of water in the State using 75 per cent of the State’s water resources. The priority of water distribution has been domestic, irrigation and industry.
Except for coastal regions and delta region of River Cauvery, most of the districts are in lower category of depth of water table in the post monsoon season (Groundwater yearbook of Tamil and U. T. of Puducherry (2016-2017)). In the past five years, Tamil Nadu has seen one of the most rapid decline of groundwater table in the world (0.34 meters per year).
Some districts in the Cauvery region show highest relative decline in ground water, Cuddalore, Pudukkottai, Salem, Sivagangai, Thanjavur, Thiruvarur and Thoothukkudi have witnessed more than 40 per cent drop. Though Pudukkottai and Sivagangai belong to safe category as of now they may soon belong to the critical category. This has enormous implications for agriculture, domestic needs as well as water intensive industries.
Challenges in Agriculture
Tamil Nadu
Paddy occupies more than 61 per cent of the total cultivated area of Tamil Nadu and is cultivated in three seasons (April-July, August-November and December-March). The average yield rate has been 3070 KG per hectare. Of the 32 districts, except Chennai which does not cultivate paddy and Nilgiris which has less than 1 % under paddy, rest of the districts cultivate paddy. Thiruvarur, Thanjavur and Nagapattinam are the three major districts with 1.66, 1.62 and 1.57 lakh hectares under paddy and rank low 30, 23 and 27 in terms of per capita income, respectively. Kancheepuram and Ramanathapuram have more than 70 per cent of area under paddy. Thiruvallur, Villupuram, Thiruvannamalai, Pudukkottai, Madurai and Sivagangai have more than 40 per cent of the cultivated area under paddy. Whereas Namakkal, Krishnagiri, Coimbatore and Tiruppur have less than 10 per cent of total cultivated area under paddy. Villupuram, Vellore, Salem, Dharmapuri, Coimbatore, Tiruppur, Perambalure, Thanjavur, Nagapattinam are over exploited in terms of ground water and paddy is a hydrophilic plant and requires standing water.
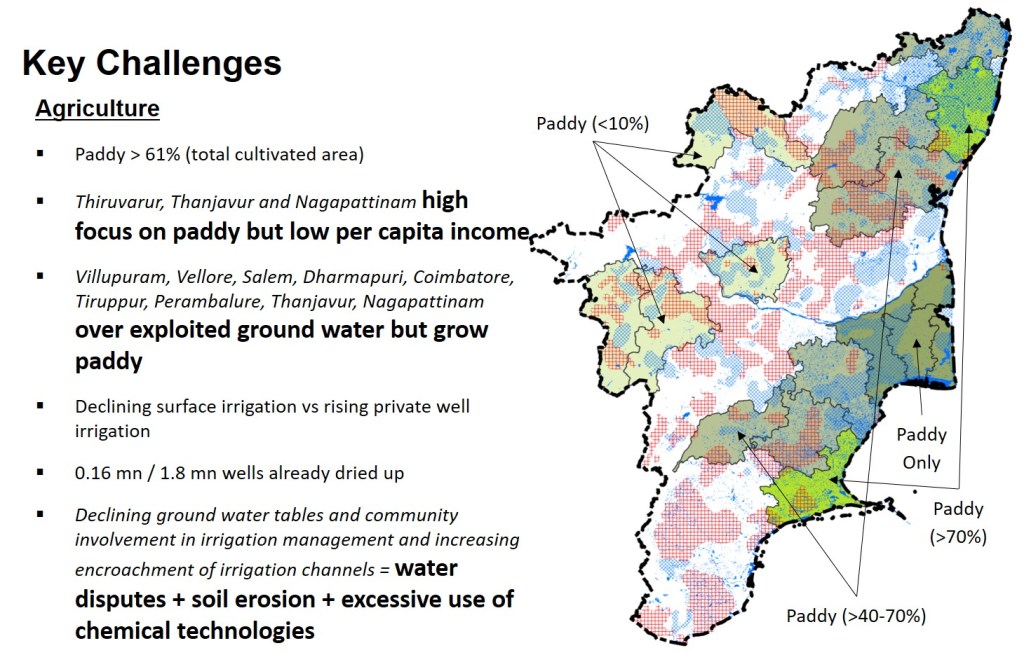
Surface irrigation is on the decline and private well irrigation has been on the rise, out of the 1.8 million wells, 0.16 million wells have gone defunct already. The worrisome aspect is decline in the area irrigated by canals and tanks and the rise in the area irrigated by wells. The extreme dependency on wells would further reduce the ground water and increase the cost of extraction of water.
Declining ground water tables, encroachment of irrigation channels, decline of community involvement in maintenance of irrigation structures, water disputes added by the woes of soil erosion due to excessive use of chemical technologies haunt Tamil Nadu agriculture scenario.
Odisha
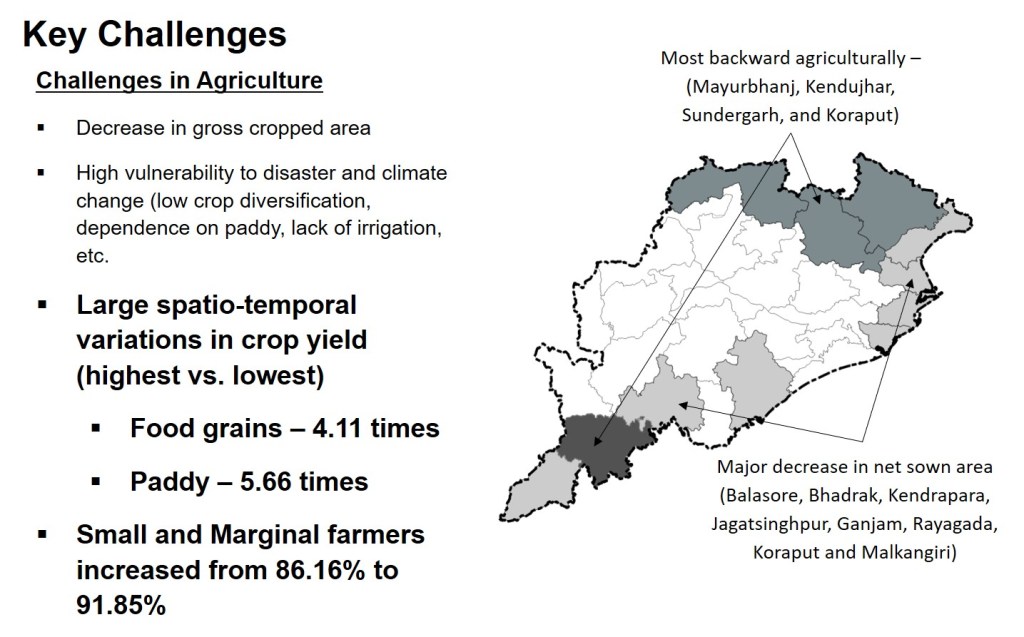
There has been a decrease in the gross cropped area for production of major crops, especially food grains (from 6.91 million hectare in 2008-09 to 6.21 million hectare in 2017-18). During the same period, the gross cropped area under oil seeds and vegetables has reduced from 0.82 million hectares to 0.60 million hectares, and 0.67 million hectares to 0.65 million hectares, respectively.
The net sown area decreased by 3.21% in between the 2008-09 and 2012-13 and by 15% between 2013-14 and 2017-18. The coastal districts (Balasore, Bhadrak, Kendrapada, Jagatsinghpur and Ganjam) and districts bordering Andhra Pradesh (Rayagada, Koraput and Malkangiri) have greatest decrease in net sown area.
Productivity levels of crops saw an upward trend between the years 2008-09 and 2013-14, and then a decreasing trend from 2013-14 to 2017-18. Indicating high vulnerability to natural calamities and disasters. The average rice productivity initially increased from 1553kgs/hectare to 2361 kgs/hectare and then reduced to 1739 kgs/hectare during the same period.
The agricultural growth rate of Odisha, has been lower than that of India over the past two decades, due to low crop diversification, high concentration on paddy cultivation, and low proportion of irrigation and other productivity enhancing inputs including mechanization and optimized utilization of fertilizers for agriculture as compared to other states.
Sambalpur has the highest productivity of food grains whereas Kalahandi has the lowest agricultural productivity. The districts of Baleshwar, Cuttack, Puri and Ganjam, Sambalpur and Bolangir are agriculturally more advanced with good irrigation facilities, better access to fertilizer, high literacy rates and infrastructure whereas Mayurbhanj, Kendujhar, Sundergarh, and Koraput are the most backward.
Variations in natural aspects (annual rainfall, location, topography, natural endowments etc.) technological aspects (irrigation spread and cropping intensity, crop diversification, consumption of inputs like fertilizers, high yielding variety seeds, etc.) and social aspects like (average size of operational holdings, adoption of technology, rural literacy, commercialisation of agriculture etc.) has resulted in spatial-temporal variations and disparity in productivity with yield in top most district being 4.11 times and 5.66 times higher than bottom most district for food grains and paddy respectively.
The number of small and marginal farmers increased from 86.16 per cent (2005-06) to 91.85 per cent (2010-11) whereas the number of semi-medium and medium farmers reduced from 13.54 per cent (2005-06) to 8.03 per cent (2010-11) of total land holdings accounting for 70.48 per cent (increased from 58.36 per cent) and 26.8 per cent (reducing from 38.03 per cent) of total area respectively during the same period.
The state is endowed with an extensive network of rivers and streams and has net dynamic ground water resources of 16.69 billion cubic metre of which exploration to the extent of 5.02 billion cubic metre has been made. The state utilizes 82.6 per cent of the ground water draft for irrigation, 15.4 per cent for domestic purposes while only 1.9 per cent is utilised in industries. However, the net irrigated area has steadily declined from 2.19 million hectare (2008-09) to 1.25 million hectare (2012-13).
While overall situation of ground water in Odisha appears to be safe, certain blocks in all coastal districts (Ganjam, Puri, Jagjitsinghpur, Kendrapada, Bhadrak and Baleshwar) are already partially/ severely affected by salinity. Of these Ganjam, Puri and Baleshwar happen to be high productivity districts with better irrigation facilities.
Tribal Development Challenges in Odisha
Even after 60 years of tribal development interventions, there are huge gaps in developmental indices between the tribal and general population both at the national and state levels. As per a UNICEF report, the maternal mortality rate in the SC/ST population in Odisha stands at a high of 67 per cent against 55 per cent at the national level. A World Bank report reveals anti-poverty programme awareness among tribal in Odisha is significantly lower than in Madhya Pradesh and Karnataka. ST enrolment in primary schools stand at a low of 22 per cent in 2007-08. As per FAO report, 35 per cent of ST households (farmer) of Odisha are buried in debts. As many as 78 per cent of ST households are in food inadequacy category against 50 per cent in the general category as of 2009 (Review of Tribal Sub-Plan Approach in Odisha, Government of Odisha).
Despite improvements, the literacy rates among scheduled tribes is only 52.24 per cent as against state average of 72.87 per cent, with female literacy rates as low as 41.20 per cent in 2011. The sex ratio in the tribal sub plan areas is 1041, however, the same has reduced to 985 in child population between 0-6 years age group. (Census of India, 2011).
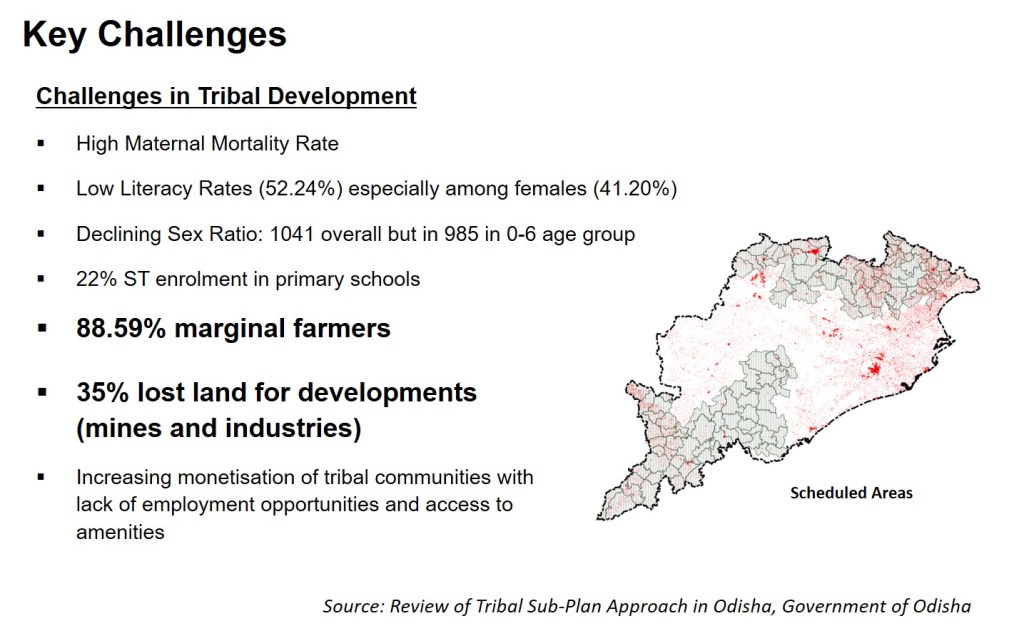
Grey hatches in the image show scheduled areas whereas the red colour shows settlements (urban as well as rural).
Majority of ST people (88.59 per cent) are marginal farmers. Lack of irrigation facilities and major chunk of unutilized land, and restricted use of non-timber forest produce leads to seasonal migration of tribal labour. About 35 per cent of STs have lost their lands for different developments, mines and industrial projects pushing them into joblessness, landlessness, homelessness, and loss of access to common property resources, marginalization, increased morbidity, social disarticulation and lack of employment opportunities.
In view of weak implementation of The PESA Act, 1996 in Scheduled Areas, (empowering the Gram Sabha with powers in resource management and decision making in tribal development process), project authorities show keen interest for construction works rather than implementation and monitoring the Income Generating Scheme (IGS) programmes (Review of Tribal Sub-Plan Approach in Odisha, Government of Odisha). Development interventions extended by the tribal development agencies are mainly on irrigation, agriculture, horticulture, animal husbandry, household industries, small business, formation of Self Help Groups (SHGs), vocational training, provision of fire proof roof, communication, creation of education infrastructure, power supply, drinking water supply and awareness training with an area based approach. Extremist activities spread in inaccessible hilly and dense forest and tribal areas have also resulted in limited progress of implementation of tribal development programmes.
Tribal communities are increasingly becoming monetized, however, ST people in the villages of ITDAs, Micro Projects, MADAs and Cluster Approach Pocket lack knowledge about decentralized market and regulatory market systems. Landlessness and migratory nature of people are limiting the smooth implementation and execution of schemes especially in micro projects necessitating a review of the existing policies, schemes and programmes of tribal development.
Mining Challenges of Odisha
The large mineral deposits of the state are in direct conflict with its other natural resources like forest, marine and water resulting in a direct impact on its rich biodiversity, catchment of major rivers, and habitats of the poor and marginalised tribal population (especially in Kendujhar, Sundergarh, Mayurbhanj, Koraput, Kalahandi, Bolangir and Phulbani districts). Furthermore, many of the districts with major mining deposits are low on urbanisation and high on poverty.

The four images above show the conflicts of mining belts (purple boundary) with settlements (red colour), scheduled areas (grey hatches), water bodies (blue colour) and forests and protected areas (green colour).
There were only 25405 workers directly employed in major mineral activities in 2016—17 (a reduction from 59417 workers in (2012-13) (Economic Survey of Odisha, 2017-18). Considering, mining has been a major contributor to the state as well as districts economy, its impact on environment and possibilities of social degradation (tangible and non-tangible) need to be adequately addressed.
For example, Kendujhar has about 31,256 hectares of land under mining, dominated by small sized open cast mines (ferrous minerals) wherein individually, most of them conform to prescribed standards, but the cumulative effect has been beyond the carrying capacity of the region leading to environmental deterioration. This has led to loss of forest cover, increase in wasteland by 123% within 15 years, degradation of agriculture and soil quality, and human-wildlife conflicts (especially with elephants resulting in their dwindling population).
Issues of air pollution, water pollution, health of communities, lack of sustainable livelihoods, and economic disparities has resulted in nearly 62 per cent of population living below poverty line and the district scores poorly on various human development indicators, especially in the fields of education and health. With majority of the minerals exported outside the State for processing and value addition, it is obvious that the value earned with the mining has not trickled down to the local communities and workers.
Challenges related to Environment
Environmental Challenges in Odisha
Odisha has two national parks, 18 wild file sanctuaries, covering a total area of 7959.85 sq.km. There are two tiger reserves in Odisha (Satkosia and Similipal) and five elephant reserves (Mayurbhanj, Mahanadi, Sambalpur, Brahmani Baitrani and South Odisha accounting for about 16,302 sq.km.). There are more than 524 species of birds in 8 Important Bird Areas of which 2 are not officially protected, all of them together accounting for approximately 5081.08 sq.km. There are also two Ramsar Sites (Chilika Lake and Bhitarkanika Mangroves) and one Biosphere Reserve (Similipal).
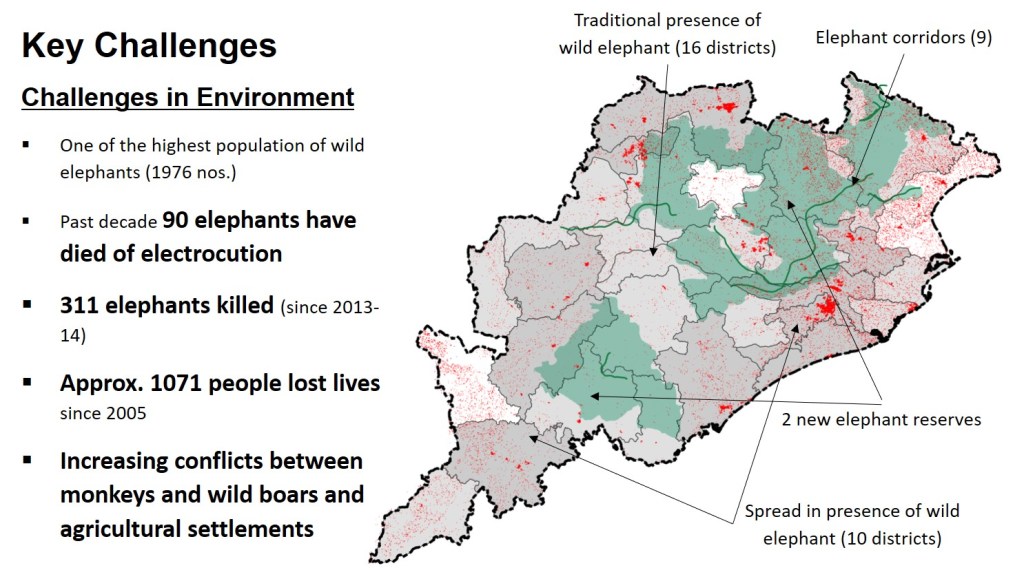
As a state, Odisha also accounts for one of the highest population of wild elephants with a count of 1930 as of 2012 as per MoEF&CC estimate, 1954 in 2015 and 1976 in 2017 based on new counting method – synchronised elephant census (fifth highest of all states with wild elephants). Over the past decade 90 elephants have died of electrocution in Odisha (second highest of all states with wild elephants). There are nine elephant corridors within Odisha that are considered critical due to extensive human habitation leading to human-wildlife conflicts. Since 2013-14, 311 elephants have been killed with annual average elephant deaths estimated at over 70. During the same period, 275 humans lost their lives in elephant depredation, whereas between 2005 – 2014, about 796 people had lost their lives.
Furthermore, most of these protected and eco-sensitive areas are interspersed with settlements. Traditionally wild elephants were known to be present in 16 districts and they have further spread to 10 more districts leaving only Baleshwar, Bhadrak, Debagarh and Nabarangpur. (see image below) Conflicts with monkeys and wild boars and agricultural settlements are also increasingly becoming a cause of concern.
The state has identified various corridors of growth that require development of infrastructure and would eventually promote urbanisation and agglomerations around it. With components like expanding highways, industrial use of land, agriculture, water consumption, etc. these development corridors will increase competition and conflicts with available environmental resources like protected and unprotected environmentally sensitive areas including forests, heritage and archaeological monuments, unique tourism destinations, water and grazing lands as they pass through natural settings of the regions.
Environmental Challenges in Tamil Nadu
Tamil Nadu has five national parks, 21 wild file sanctuaries, one conservation reserve covering a total area of 3829.82 sq.km. There are three tiger reserves in Tamil Nadu (Kalakad Mundanthurai, Anamalai and Mudumalai) and four elephant reserves (Nilgiris, Coimbatore, Anamali and Srivilliputtur) and more than 450 species of birds in 34 Important Bird Areas of which 20 are unprotected accounting for approximately 1620.34 sq.km. Furthermore, five more unprotected important bird areas have been recently added to the list. There is also one Ramsar Site (Point Calimere Wildlife and Bird Sanctuary). A substantial part of Nilgiris Biosphere is also part of the state extending to Nilgiris, Coimbatore, Erode districts.
As a state Tamil Nadu also accounts for one of the highest population of wild elephants 4015 as of 2012 as per MoEF&CC estimates and 2761 in 2017 based on new counting method. Over the past decade 50 elephants have died of electrocution. There are six elephant corridors within Tamil Nadu that are considered critical due to extensive human habitation.
Due to clearance of forests and trees outside forests (legal and illegal) for agriculture, plantations, residential, highways, railways, and other infrastructure project, has led to fragmentation of contiguous forest into three separate landscapes as Anamalai, Periyar, and Agasthyamalai. Elephants are often found stranded and scattered in enclaves looking for food and water or at highways and rail lines that cut across these corridors, exposing them to accidents. There is an increase in human-elephant conflicts in the region. And it is estimated that a total of 879 peoples have died in during 2005-14 due to human-elephant conflicts.
On August 9, 2018, for instance, in response to a PIL, the Supreme Court ordered the state to close within 48 hours, 39 hotels and resorts constructed in an elephant corridor in Nilgiris Hills.
Furthermore, most of these protected and eco-sensitive areas are interspersed with settlements. For example, the industrial growth of Coimbatore is not just confined to Coimbatore, but has spread into the neighbouring towns of Coonoor, Ooty, Palakkad, Tiruppur, Mettupalayam, and Pollachi, forming an “urban network” that is economically and politically connected. This has resulted in extensive degradation of River Noyyal, with potable water in Vellingiri Hills becoming a cesspool of effluents and has a dry catchments as it passes downstream from Coimbatore, Tiruppur, Erode, Karur and Tiruchirapalli (WWF 2011)
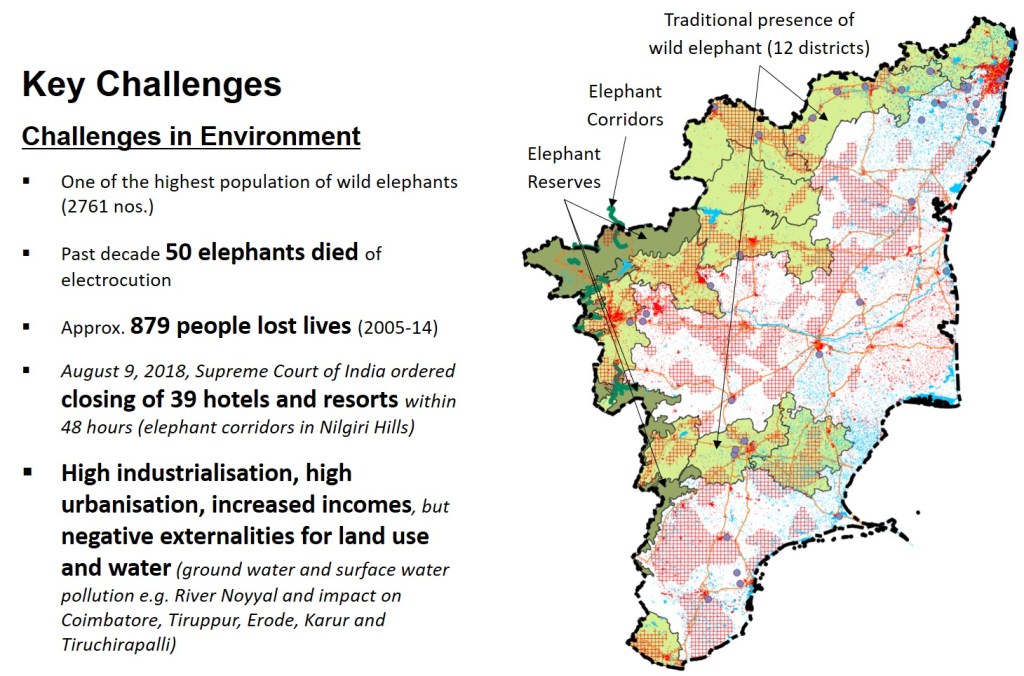
Dark green areas in the image show Elephant reserves, whereas light green areas show the districts with traditional presence of wild elephants. Note the critical aquifer areas (red hatches) formed by overexploitation due to agriculture conflict with traditional habitats of wild elephant. Also note how the elephant corridors pass through them. Furthermore, note how the settlement pattern (red colour) with heavy industrialisation and the urbanisation corridors (red colour along red line) conflict with waterbodies (blue) resulting in depletion (red hatch) as well as pollution of rivers.
Tamil Nadu has faced issues of ground water pollution due to industrial effluents in the past. Chennai – Manali, Cuddalore, Vanniyambadi, Thoothukkudi and Tirupur, are well known for petrochemical, pharmaceutical, leather and textile production and processing sectors. These clusters are also known for their higher levels of pollution. For instance, the Orathampallayam dam meant to serve as a reservoir for River Noyyal became a cesspool of effluents soon after its commissioning in the year 1992 (Ramakrishnan, 2018). Similarly, the untreated effluents from the leather units in Vaniyambadi, Ambur and Vellore let out in the Palar river which supplies water to the Northern Tamil Nadu, affected the ground water making it unfit for drinking and agriculture. High industrialisation in Tamil Nadu suggests that while it contributes to urbanisation and income, the negative externalities have serious implication for land use and water.
The vision 2023 document identifies various corridors of growth, need for infrastructure and ten world class cities and agglomerations around it. As in many cases these corridors pass through natural settings of the regions, increasing competition and conflicts with available environmental resources like protected and unprotected environmentally sensitive areas including forests, heritage and archaeological monuments, unique tourism destinations, water and grazing lands due to development projects like expanding highways, industrial use of land, agriculture, water consumption, etc. are envisaged.
Is it time? Yes. Let us understand the Hierarchical Spatial Planning Framework to address these challenges. Click here.

2 thoughts on “Chapter 14: Spatial Representations of Key Challenges”