
Book a window seat, board the plane to take the flight to urbanisation. You will see the land uses change below you. The birds eye view is the perfect introduction to the concept of levels of plans and scales. This chapter is part of a series on Hierarchical Spatial Planning Framework
Have you ever flown in an aircraft? If yes, which seat do you take, the window or an aisle? Personally, I always prefer the window seat. Not because of the lesser disturbance (that is an added advantage). But more because I really like to see the birds eye view of the changing land use and land cover. Especially during take-off and landings. Morning, noon, afternoon, evenings, or night. Does not matter. I just love the view. And yes, I call it ‘the flight to urbanisation’
Check out the set of images below. They were clicked while I was landing at Jolly Grant Airport between Dehradun (important urban centre and capital city of Uttarakhand State in India) and Rishikesh (tourist town).

(Apologies for the average quality. They we clicked from a mobile and the aircraft window was not exactly the cleanest.)
What do you see?
The first image shows a forest. There is a road (red) passing through it. And there are hills on the top right-hand side. And rivers or streams (blue) originating from there and flowing to the left. The roads cut across the rivers.

Now as we move a bit further. The second image shows a boundary to the forest. Interestingly, there is a road (red) along the boundary. We have agricultural land on the left, and forest on the right-hand side of the road. Two streams are merging near the horizon. And there are three more streams flowing from right to left and merging into one. There are a few buildings that we can see along the other two roads (red).

It is important to note that there is a change in land cover and land use from vegetation (forest) to vegetation (farms/crops) along with minor built-up (settlements) and water bodies (streams).
And as we move further, the third image shows that the streams have all merged into a river (between blue lines) and the farmland (green polygons) has started giving way to the settlements (red polygons). The density of settlements is higher near the river, possibly indicating that the settlements started along the banks of the river and are now sprawling to the agricultural peripheral development along the roads.

Let us look at the last image which is now much closer to our landing destination. Now we can identify a few land uses as well instead of just land cover.
The farmlands have been replaced with buildings; a highway is passing in between. There are some trees on the bottom left (either remnants of a forest or plantation) and industrial shed on the right-hand side. We can also identify a few religious structures (temples mid right-hand side) and possibly a school building along the road.

It seems, urban sprawl is rapidly taking over the farmlands.
So how will it look like in future?
See the following set of images. These are from Delhi. (I was lucky to be able to click them while taking off. The sky was surprisingly clear)

Do we see some similarity? Can we figure a similarity in pattern?
The first image shows a clear divide with left side having extremely dense built-up and the right side having possible remnants of a forest giving way to sparse built-up land cover.

As we move further, the second image reveals four distinct phases of development. Zone 1 seems to be oldest and most densely packed built-up cover. The zone two seems to have planning but still high density. Zone three seems is much more open and spaciously planned as compare to zone two. And zone four shows urban sprawl along the periphery of the city.

As we move still higher (we are taking off in an aircraft – remember?), we see lesser details but a clear distinction between river dense city (older parts) and newer planned city. This is evident in the third image below.

Interestingly, as the aircraft changes direction we are once again a bit lower and we distinction between planned and unplanned is more evident. With a clear spatial order visible in the planned areas (zone two) and urban lungs or urban forestry.

It is not necessary the Dehradun will evolve exactly like Delhi. The point I am trying to make is that possibly every city will end up with somewhat similar development patterns and land use land cover changes… with its own unique character and to a different degree of density of course.
Hopefully, we agree on above and move further. We take a different flight. This time to Bhubaneshwar (capital city of Odisha, one of the least urbanised states in India). See image below.

The top left image shows a forest with road. The second image shows a mining settlement (town or village) next to a hilly forest. Note that no more details are visible from this height.
The flight has just started descending and now we can see villages, forests, plantations, farmlands (fallow as well as cropped) and roads in the third image.
As we descend further, road passing between farmlands and leading to an urban area is clearly visible in the fourth image. We can still not make any sense of individual buildings as of now.
Note that whereas in the first two images we are not able to distinguish between urban and rural settlements, in the third and fourth images we can distinguish between urban and rural settlements.
As we descend further, we can distinguish the urban and peri-urban areas (urban sprawl, plotted developments, farmhouses etc.) from the first two images in the second row.
In the last two images, the bus terminal, road junctions, residential and commercial areas can be clearly distinguished.
In continuation of the above series of images, the following image was also taken a few moments before landing.

What do we see here? Can we identify some of the commercial buildings, or plotted developments, or individual housing, or townships, of low-rise apartments, schools, institutional buildings, gardens, playfields etc.?
Try identifying a few. It would be fun.
A little bit closer and we would be able to identify the broad layout within the premises.
Which brings us to the construction plan.
Construction Plan
It is important to note that each of these buildings need a firm project approval, a construction plan which maintains distances to neighbouring constructions, follows rule to main access, follows height and façade restriction etc. Whether urban or rural it does not matter. There are certain development control regulations, building construction permissions, completion certificates, building use permissions that each of these must abide by.

Master Plan
Each of these building approvals has to be compliant to a set of norms set by the urban or rural local body (might be own or state defined or just an adaptation of URDPFI Guidelines). Furthermore, the purpose of the building must be compliant with the land uses as demarcated in the local areas plans (town planning schemes) and master plans / development plans for the local body. Whether residential, commercial, industrial, institutional, open space, infrastructure, public utility etc. These are defined in the master plans. Master plans are statutory in nature.

There are about 8000 cities, towns, or urban settlements in India. It is estimated that about 2500 of these have some form of spatial plan/master plan/ land use plan. Many of these have expired or are incomplete. Furthermore, less than 100 are regularly updated on periodic basis.
Regional Plan
Each of these master plans in Indian cities is generally prepared independently with little connection to regional linkages.
Back in 2016, I had the opportunity of studying master plans in Rajasthan. There were 188 master plans (and 228 urban local bodies), and one incomplete. Some had expired recently and awaiting updates, whereas some had expired for a decade, or two. I casually, checked the population projections and realised that considering the conservative total of forecasted population of 188 master plans (the last population forecast f was considered for the expired plans), the urbanisation levels should be 20 per cent higher than present levels. I did an analysis of likely population distribution for next 15 years and shared it with the government. Now I am eagerly awaiting for the Census 2021 results. It will be a big day. Keeping fingers crossed. It will tell me if my concepts were right or wrong.
The primary reason being the push and pull factors of each city on the other was not accounted for.
Consider the image below.
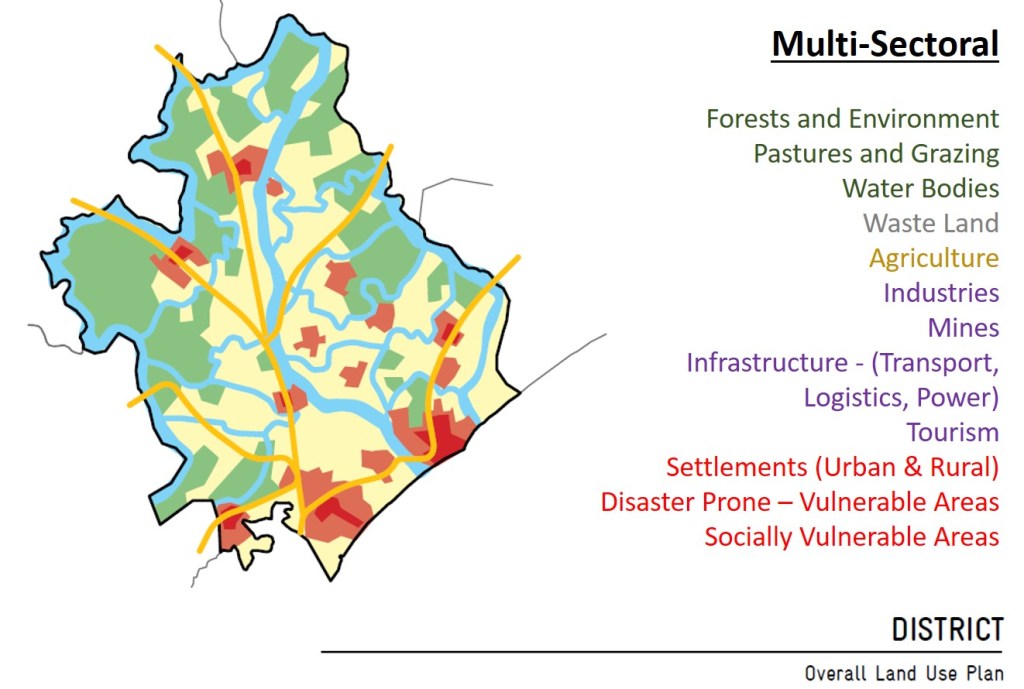
Suppose the master plan showed in the previous image was of the largest city of this district (the right most dark red mark in the above image). And the light red areas are the ones where it expands. Then, the amount of in-migration into the city would be balanced by the pushes and pulls exerted by the economy of the nearby cities as well. Since the city in this case is geographically constrained by rivers and extremely disaster prone, the city on its left with a larger number of roads connecting near it might expand more rapidly. Other cities (in the upper part of image), despite being on a seemingly important highway, may be constrained by forests and presence tribal belts or socially vulnerable areas around them.
Hence a regional balance needs to be considered with a multi sectoral approach. India has been encouraging the preparation of district plans for some time now. But in practice, they are essentially a collection of annual budget.
These district or regional plans need to be spatial. They need to be strategic and should be giving directions and priorities for consideration at masterplan levels. They may or may not be statutory.
State Policies and Spatial Strategies
We have seen that regional plans address the multi sectoral aspects and give direction and priorities. When we look at a state level governance structure, there are multiple sector departments with their representatives at region/district level. The policies are essentially formulated at state level, the overall vision, its strategic positioning vis a vis other states in the country. This necessitates the requirement of overviewing and connecting the regional plans within the state with and link them to pushes and pulls from other states as well.
Hence, the states should have a state land use planning policy and state spatial strategies.

National Visions and Policies
A nation has multiple states. And national policies for each sector tend to be visionary to take the country in a direction of growth. Strategic overview and development patterns are evolved through various policies, schemes, and programmes like smart cities, industrial corridors, national forest reserves, etc. with fiscal incentives. The essential idea is to focus on strength and ensure balanced development across all states.
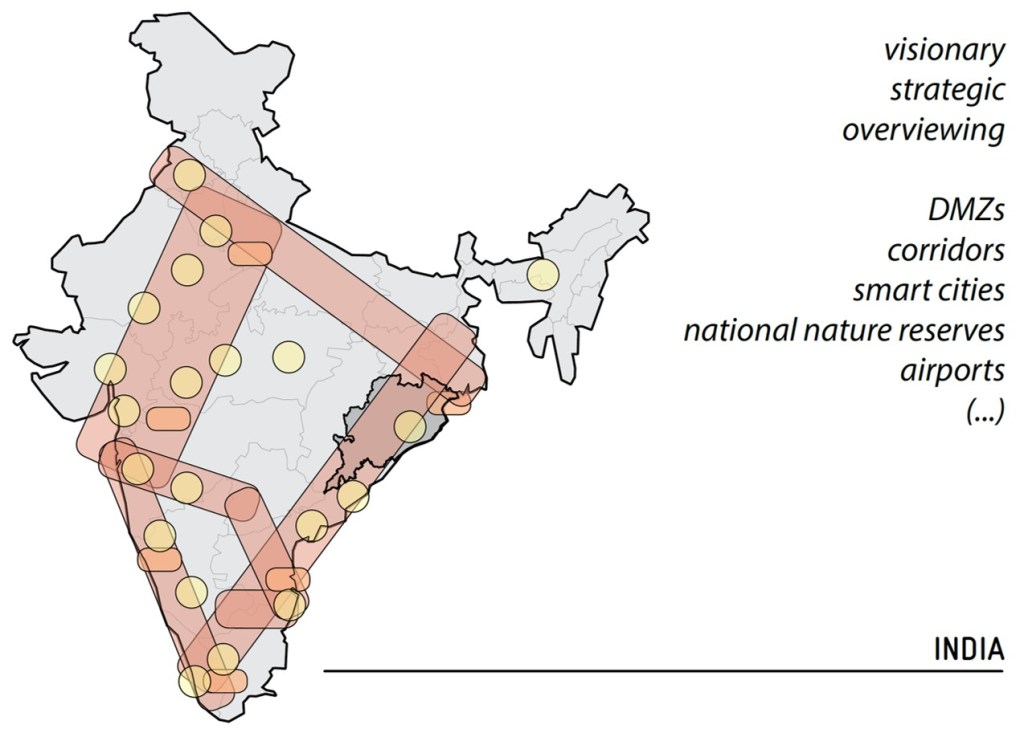
Thanks, Georg, for these amazing graphics showing the hierarchy of plans.
Levels of Plans and Scales
We have seen that there are multiple levels of plans that have a set-subset sort of relationship. The visionary (country and state), the regional, the supra local (sector specific), and local level (Master plans, and its further details). An indicative image explains it below.

Try to explore and search internet for varieties of spatial plans, it would be interesting and an eye-opener.
This brings us to the big question what should be the scale?

It is obvious from the image above that the plans prepared at Visionary level would be at a smaller scale and the ones prepared at the detailed local levels would be at a much larger scale.
But what should be the scale?
Well… It is pretty much up to the person preparing the plans. Consider this.
The largest district in India is Kutch with an area of 45,652 sq.km. and the smallest is Mahe with 8.69 sq.km. There are nine states (Haryana, Kerala, Meghalaya, Manipur, Mizoram, Nagaland, Tripura, Sikkim, and Goa) that have area lesser than the district of Kutch. Except for the Union Territory of Ladakh (59146 sq.km.) all other union territories of India (Jammu and Kashmir, Andaman and Nicobar Islands, Daman, Diu and Dadra & Nagar Haveli, Puducherry, Chandigarh, and Lakshadweep) are smaller.
The average district size is 4356 sq.km. since 2019 (we added 87 new districts since Census 2011) (click here for more details).
In such a scenario there cannot be a standard fit for all solution.
The what do we do?
We apply common sense.
How big a print of the plan do we want? What all will be visible there?
Most spatial plans would ideally be the size of an A0 or at max. two A0 sheets. If you want to carry more, it is your choice at the end of the day.
Look at the image below. We prepared it to explain the concept of scale to our partners (thanks again Georg)

After much deliberation we arrived at an understanding that any State level plans may be prepared in the scale range of 1:500000 to 1:2000000. The districts and regions may want to consider a scale range of 1:50000 to 1:250000. The local level plans would be at a scale of 1:10000 and those with more details may be at 1:500 to 1:3000.
See image below (by Georg).

Functions of Spatial Plans and Policy Guidelines for Land Use
As we come towards the end of the flight to urbanisation, we learnt about the various levels of Spatial Plans and the concept of visions and policy guidelines for land use and land cover.
This made us curious as to what other countries practice. The Organisation for Economic Cooperation and Development had undertaken as study of 32 countries for understanding their Land Use Planning structures. We collated and formatted a short compendium of those along with some GIZ experiences for the benefit of our partners. Click here to access it.
The key learning is summarised below

Hmm… Policy Guidelines!! Are we talking about a Land Use Planning Policy?!
Click here to know more.

very interesting
LikeLike